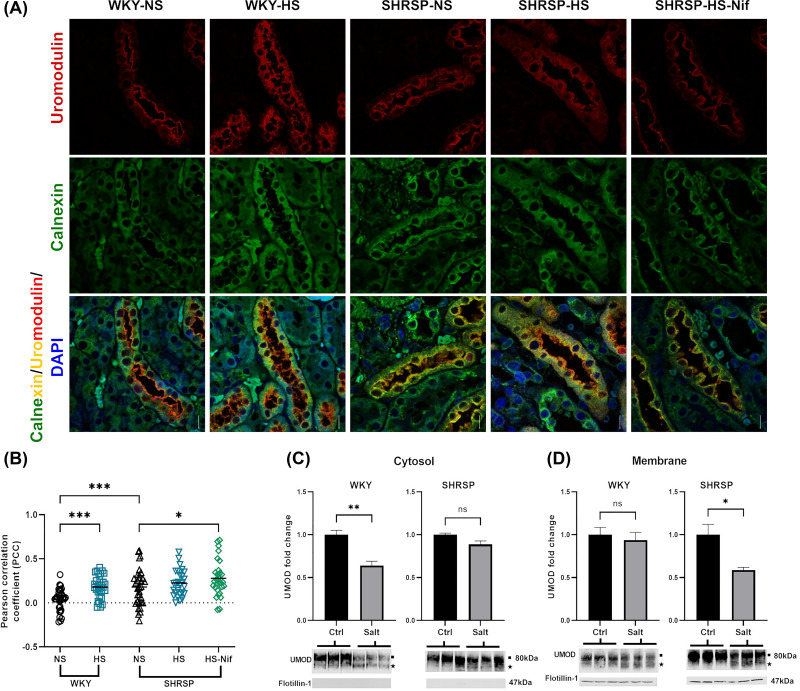
Figure 5. Salt loading effected the UMOD trafficking in WKY and SHRSP.
(A,B) displays representative immunofluorescence analysis showing UMOD (red) and ER marker calnexin (green) in rat kidney sections. Co-localization of UMOD and calnexin is represented by yellow. Nuclei are stained in blue with DAPI. Scale bar represents 20 µm. Pearson’s correlation coefficients were calculated for four representative tubules (ROI, regions of interest) from eight samples per group. One-way ANOVA was performed to determine statistical significance. (C,D) represent changes in UMOD expression of WKY and SHRSP in cytosolic and membrane fractions of TAL tubule, respectively, when incubated ex-vivo with mannitol (Ctrl) and NaCl (Salt). Western blots are representative images for two experiments with n=4 WKY and n=4 SHRSP. Flotillin-1 was used as membrane marker. Filled black square and filled black star on blots represent the mature UMOD and immature/precursor UMOD. Blots were normalized to total protein intensity using Revert 700 stain. Ns: non-significant, *P<0.05, **P<0.01 and ***P<0.001 (Student’s t test). Bars indicate mean ± s.e.m.

