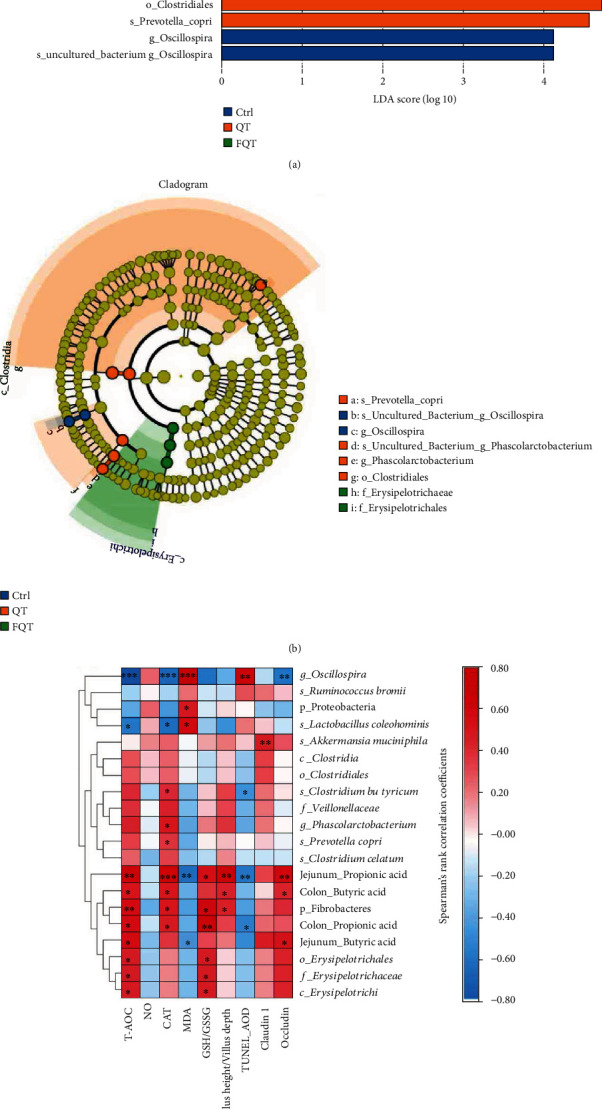
Figure 7.

The correlation between the identified differential bacteria and the indices of antioxidant capacity and intestinal integrity. (a) LDA value distribution histogram. (b) Cladogram based on LEfSe analysis. Circles from inner to outer layers represent taxonomic level from phylum to species. The dots on circles represent a term on corresponding taxonomic level. The size of the dots indicates relative abundance. Species with certain color means the abundance of this species is the highest in corresponding group. (c) Heat map of Spearman's rank correlation coefficient and significant test between the differential bacteria/marker bacteria and the antioxidant indices/intestinal integrity indices, respectively. ∗P < 0.05, ∗∗P < 0.01, and ∗∗∗P < 0.001. p, phylum; c, class; f, family; g, genus; s, species.
