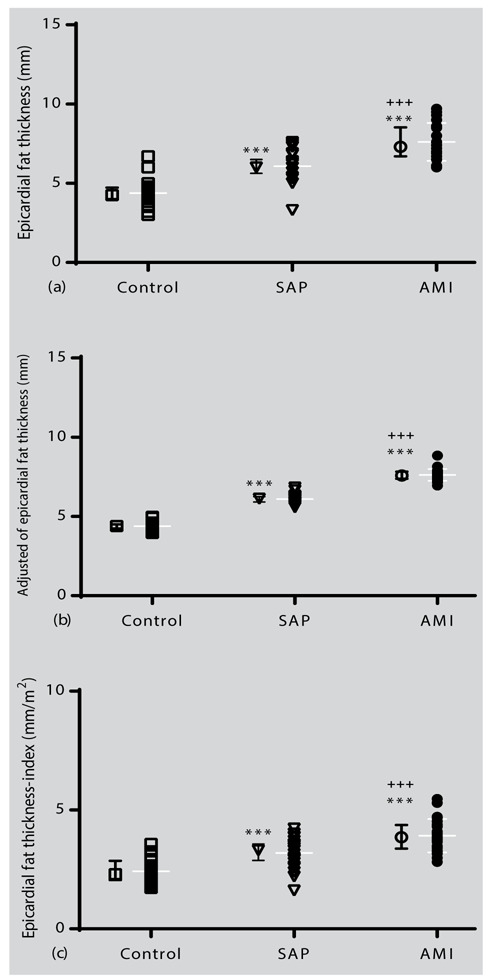
Figure 2.

Individual values and mean ± SD of the epicardial fat thickness of (a) baseline, (b) adjusted for the age, BMI, WHR, and smoking history in the study groups, and (c) EFT-index (based on body surface). Statistical differences between the control group and other groups: ***; p<0.001. Statistical differences between SAP with AMI: +++; p<0.001.
