FIGURE 6.

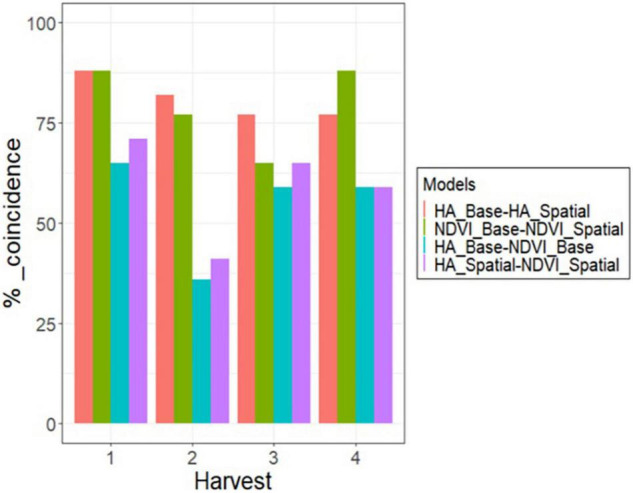
Percent of coincidence in selection for the 10% best alfalfa families between HA and NDVI, using the base and spatial model, across four harvests in alfalfa families evaluated in Citra, FL, United States.

Percent of coincidence in selection for the 10% best alfalfa families between HA and NDVI, using the base and spatial model, across four harvests in alfalfa families evaluated in Citra, FL, United States.