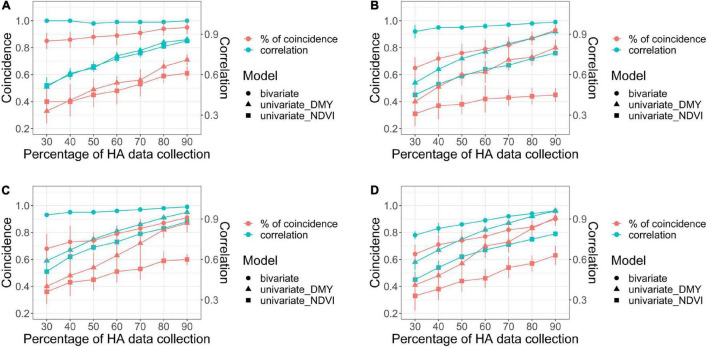
FIGURE 7.
Comparison of bivariate and univariate models (shape) for HA and NDVI for coincidence of selection after applying a 10% selection intensity (red), and correlation among breeding values for all families (green), for scenarios comparing models with increasing levels of HA data collection (30–90%) against a model with 100% HA data, across four harvests in alfalfa families evaluated in Citra, FL, United States. Harvests one (A), two (B), three (C), and four (D).

