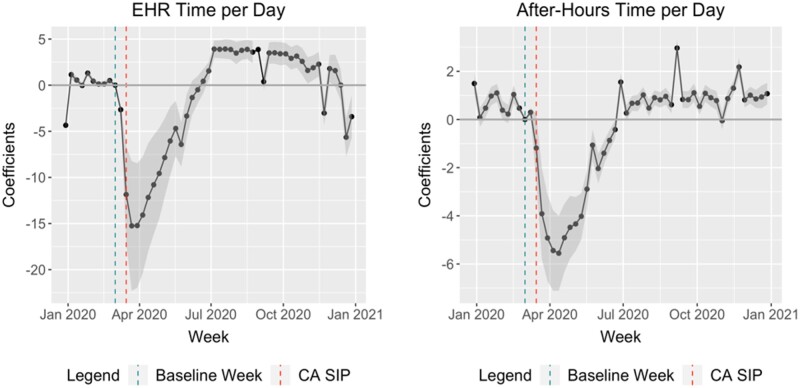
Figure 2.
Caption: total electronic health record time and after-hours time, controlling for volume and organization. Notes: Graphs are event study plots controlling for organization fixed effects and daily volume. All point estimates are relative to the week, 2-weeks prior to the first state-wide shelter in place (SIP) order in California, our proxy for the onset of the pandemic. Gray regions represents 95% confidence intervals with standard errors clustered at the organization level.

