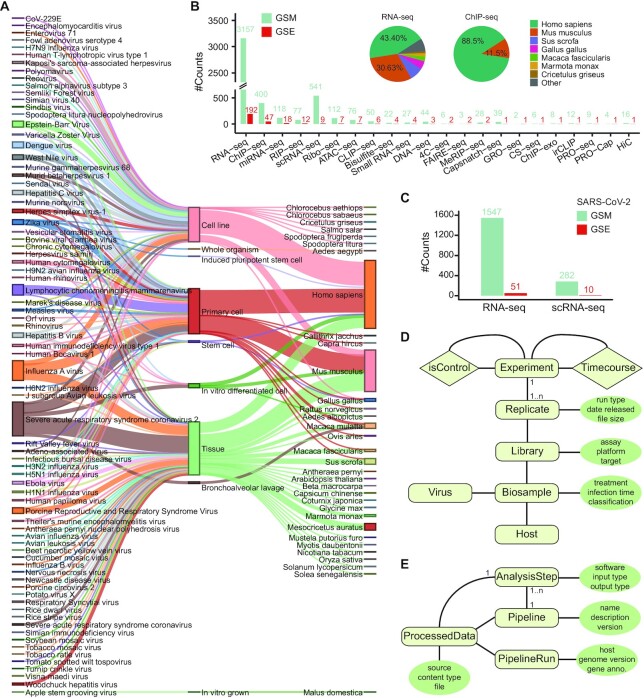
Figure 2.
Overview of metadata and data models. (A) Sankey diagram of virus, cell types, and host species in metadata. (B) Data counts of different assays by GEO series (GSE) and sample (GSM) for curated data up to Sep. 2019. The insert pie charts represent the distribution of RNA-seq and ChIP-seq samples by species. (C) Data counts of RNA-seq and scRNA-seq by GSE and GSM for SARS-CoV-2 related data up to December 2020. (D) Modeling of metadata. (E) Modeling of data analysis pipeline and processed data.

