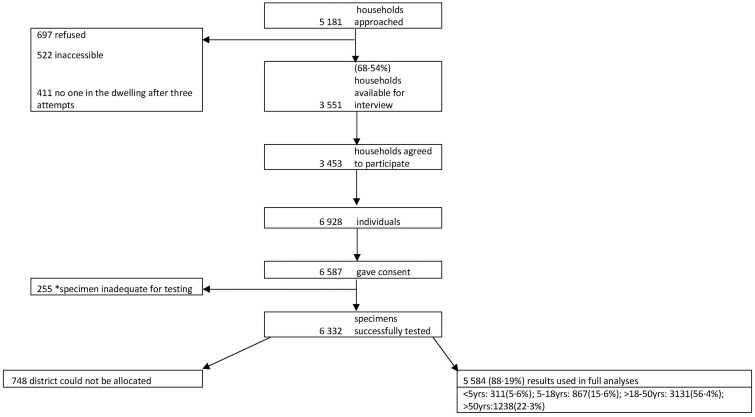
Figure 1.
Flow of households and participants included in the seroprevalence survey. We illustrate the flow of participants included in survey analyses from approaching the households to negotiate participation through to specimen collection and processing. Absolute numbers are presented. The final analysis included 5584 individuals in 26 subdistricts. *Inadequate specimen refers to dried blood spots with insufficient filter-paper saturation and hence low specimen yield for serology testing.

