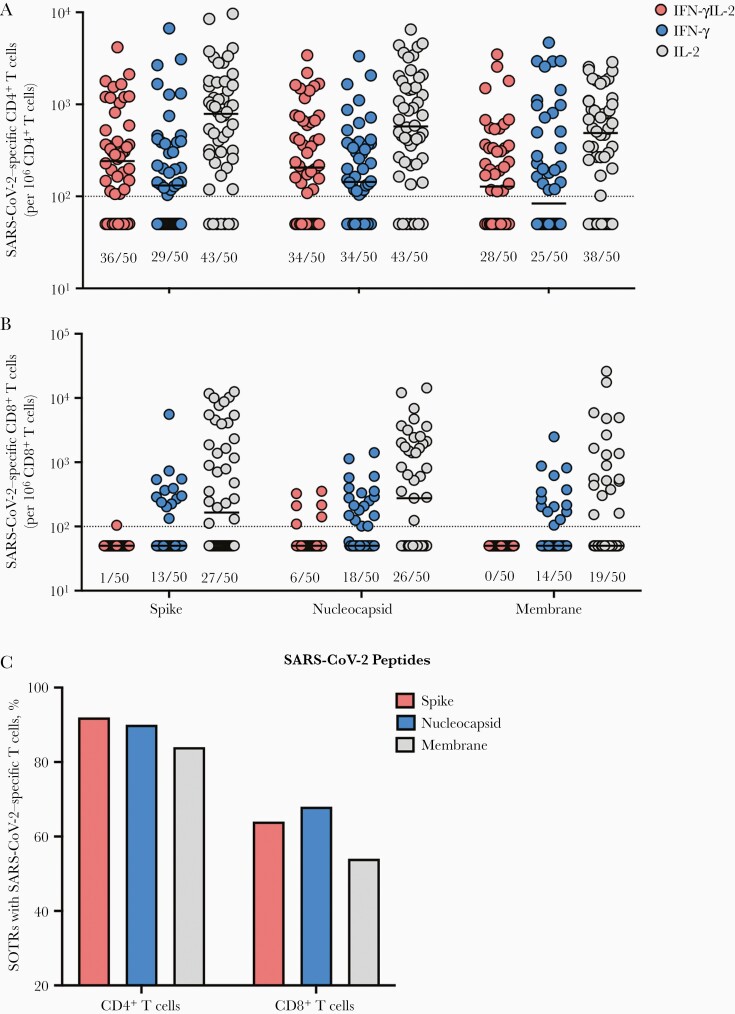
Figure 1.
Antigen-specific T cells in peptide-stimulated CD4+ and CD8+ T cells. Proportions of spike-, nucleoprotein- and membrane-specific CD4+ (A) and CD8+ (B) T cells are shown. Individual patients are shown by colored dots. The fraction underneath each bar corresponds to the proportion of solid organ transplant recipients (SOTRs) positive for each corresponding cytokine population. Bars show median. Horizontal dotted line indicates limit of quantification, 0.01%. C, Proportion of SOTRs with severe acute respiratory syndrome coronavirus 2–reactive T cells. All data shown were collected from 50 SOTRs. Abbreviations: IFN-γ, interferon gamma; IL-2, interleukin 2; SARS-CoV-2, severe acute respiratory syndrome coronavirus 2; SOTR, solid organ transplant recipients.

