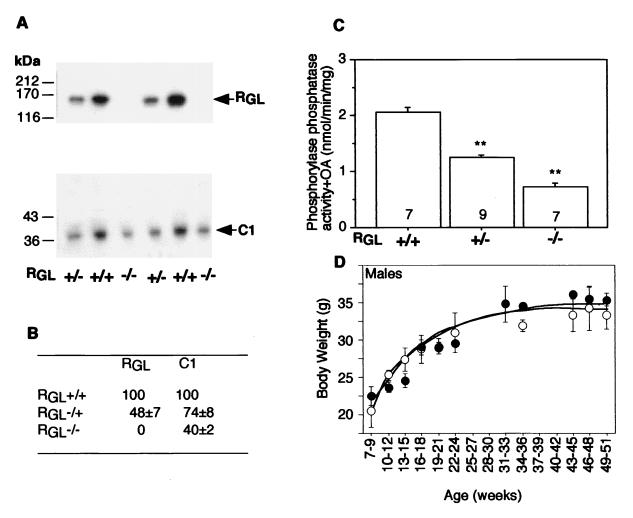
FIG. 2.
Analysis of expression of RGL and C1 in wild-type and knockout mice. (A) Skeletal muscle extracts were subjected to immunoblotting with anti-RGL (top) or anti-C1 (bottom) antibodies. (B) Quantitation by densitometric scanning of the autoradiogram shown in panel A, expressed as a percentage of the mean of the wild type ± SE (n = 6 to 8 per group). (C) Ph phosphatase activity was measured in the presence of 4 nM okadaic acid (OA) in skeletal muscle extracts as described in Materials and Methods. The number of animals in each group is indicated in each bar. Statistical significance was assessed by Student's t test (∗∗, P < 0.01). (D) Growth curves of wild-type (open circles) and RGL null mutant (closed circles) mice with 3 to 19 animals per point. The means ± SE are shown. +/+, wild type; +/−, heterozygotes, −/−, homozygote null mutants.

