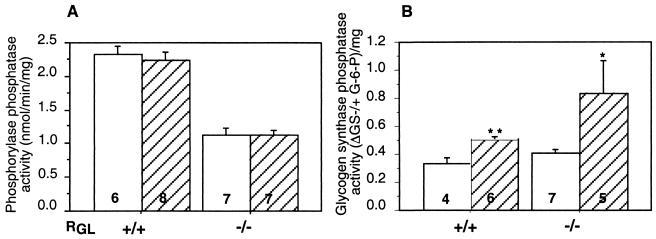
FIG. 9.
Insulin-stimulated GS phosphatase. (A) Ph phosphatase in skeletal muscle extracts of non-insulin-treated (open bars) and insulin-treated (hatched bars) mice was measured as described in the legend to Fig. 4. (B) GS phosphatase was measured by the dephosphorylation-activation coupled assay as described in Materials and Methods. The results are expressed as the difference (Δ) between the GS −/+ G-6P activity ratios measured after 15 min of incubation of GS with tissue extract and that at zero time, normalized by protein concentration. Statistical significance was assessed by Student's t test (∗, P < 0.05; ∗∗, P < 0.01). The number of animals analyzed is indicated inside the bars.

