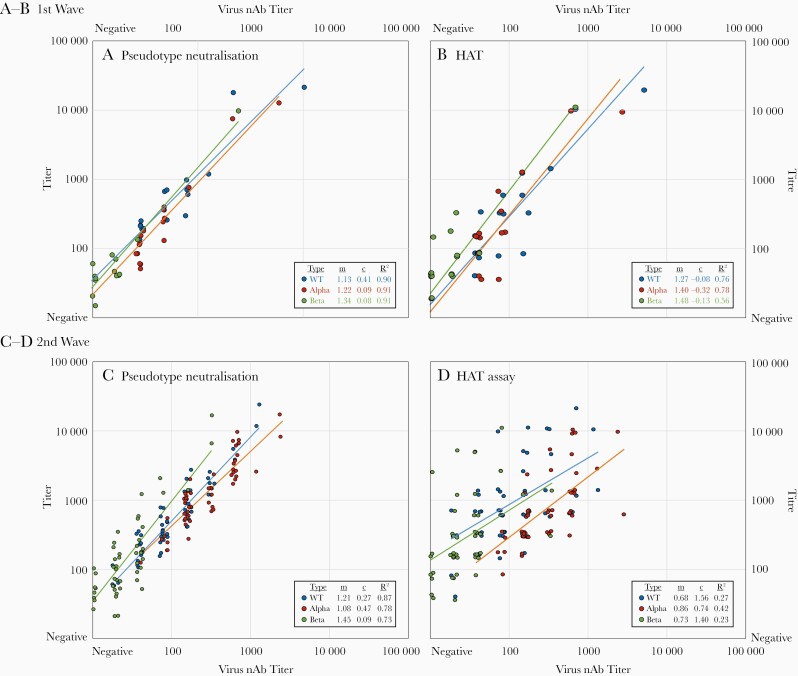
Figure 2.
Correlations between titers in virus neutralization assay (x-axis) with those in pseudotype (A, C) and hemagglutination test (HAT) (B, D) (y-axis) results for samples collected in first (A, B) and second (C, D) waves of severe acute respiratory syndrome coronavirus 2 circulation. Titers for virus neutralization and HATs have been jittered to avoid overlap. Correlations were measured by linear regression of log-transformed values that approximate to normal distributions. Regression line metrics (multiplier [m], offset [c], and R2 correlation coefficients) are tabulated for each assay, sample set, and virus strain. All interassay correlations were significant at the P=.001 level. Abbreviations: nAb, neutralizing antibody; WT, wild type.

