© The Author(s) 2021. Published by Oxford University Press. All rights reserved. For Permissions, please email: journals.permissions@oup.com
This article is published and distributed under the terms of the Oxford University Press, Standard Journals Publication Model (https://academic.oup.com/journals/pages/open_access/funder_policies/chorus/standard_publication_model)
This article is made available via the PMC Open Access Subset for unrestricted re-use and analyses in any form or by any means with acknowledgement of the original source. These permissions are granted for the duration of the COVID-19 pandemic or until permissions are revoked in writing. Upon expiration of these permissions, PMC is granted a perpetual license to make this article available via PMC and Europe PMC, consistent with existing copyright protections.

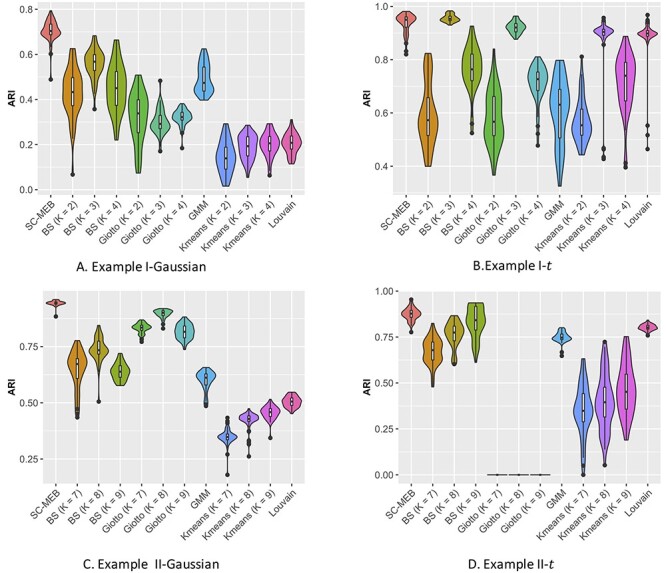
 mixture model. C. Example 2, Gaussian: PCs were sampled from a GMM. D. Example 2, t: PCs were sampled from a Student’s-
 mixture model.