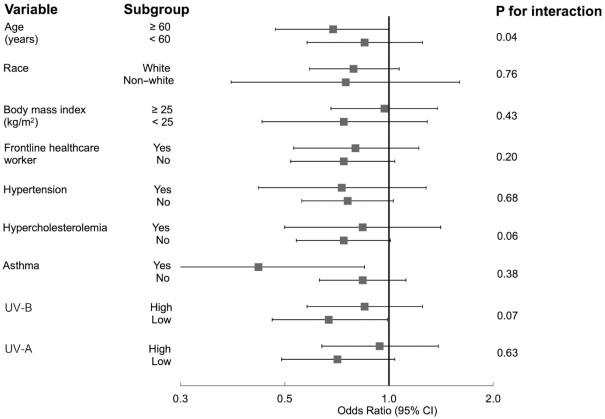
FIGURE 2.
Associations between predicted 25(OH)D concentrations and risk of SARS-CoV-2 infection in subgroup analyses. Logistic regression models were used in the analysis. The number of participants/positive for SARS-CoV-2 infection in each subgroup was 23,867/934 for age ≥60 y and 15,448/834 for age <60 y; 37,062/1651 for White and 2253/117 for non-White; 23,557/1158 for BMI (kg/m2) ≥25.0 and 15,758/610 for BMI <25.0; 11,832/717 for frontline health care worker and 27,483/1051 for non–frontline health care workers; 9409/433 for hypertension and 29,906/1335 for non-hypertension; 10,801/497 for hypercholesterolemia and 28,514/1271 for non-hypercholesterolemia; 5867/272 for asthma and 33,448/1496 for non-asthma; 19,094/839 for UV-B above the median and 20,221/929 for UV-B below the median; 19,273/809 for UV-A above the median and 19,415/939 for UV-A below the median. Values represent ORs of SARS-CoV-2 infection comparing the highest quintile with the lowest quintile of predicted 25(OH)D concentrations. Models were adjusted for age (continuous, years); race (White/non-White); smoking pack-years (0, 0.1–10.0, 10.1–20.0, >20.0); BMI (<22.5, 22.5–24.9, 25.0–27.4, 27.5–29.9, 30–34.9, ≥35.0); physical activity (quintiles); alcohol intake (0, 0.1–5.0, 5.1–10.0, >10 g/d); the Alternate Healthy Eating Index (quintiles); being a frontline health care worker; history of hypertension, hypercholesterolemia, diabetes, heart disease, cancer, and asthma (all yes/no); and 2010 Census tract median income (quintiles). COVID-19, coronavirus disease 2019; SARS-CoV-2, severe acute respiratory syndrome coronavirus 2; 25(OH)D, 25-hydroxyvitamin D.

