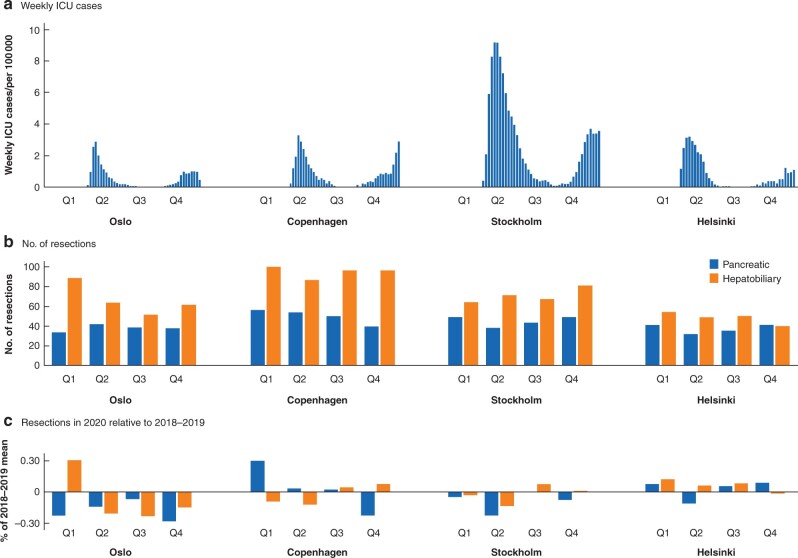
Fig. 1.
Number of hepatopancreatobiliary resections relative to COVID-19 cases in the Nordic capitals,
a COVID-19 ICU load shown for quarters (Q) 1–4 in 2020 for each Nordic capital, b number of pancreatic and hepatobiliary resections in 2020, and c resections in 2020 relative to the mean for resections in 2018 and 2019.

