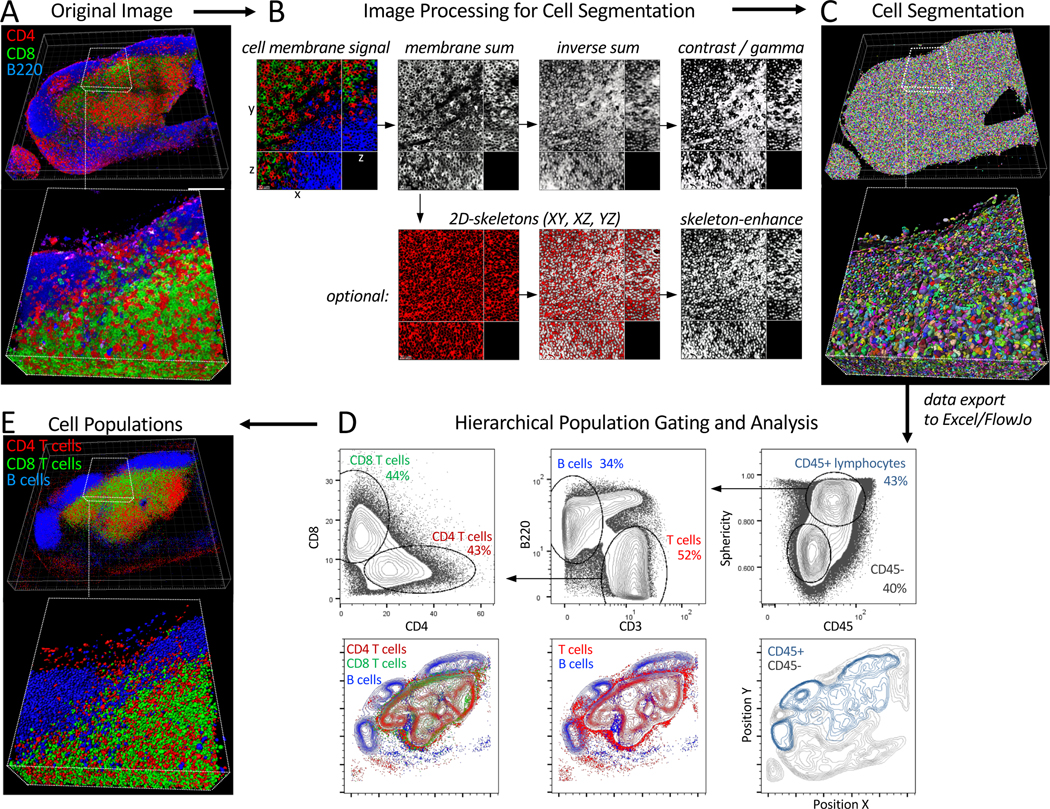
Figure 5. Volumetric Histocytometry example workflow.
250um fixed sections of steady-state murine lymph nodes were stained with antibodies against various lymphocyte populations (CD3, CD4, CD8, B220, CD45), Ce3D cleared, imaged with confocal microscopy (40x objective), deconvolved, and corrected for depth attenuation. A) Volumetric reconstruction of the 3D image in Imaris. Scale bar – 200 μm. B) Image processing steps for cell segmentation. All cell membrane signals were normalized with respect to each other and summed together using Imaris Channel Arithmetics XTension. The Sum channel was next inverted, smoothed and corrected for contrast and gamma to enhance separation between cells. An optional enhancement step (bottom panels) was also performed by generating 2D skeletons on the Sum channel in ImageJ. The skeletons were next used for Boolean gating of the Inverse Sum channel outside of the skeleton signal using Channel Arithmetics. C) The enhanced Inverse Sum channel was used to generate cell surface objects in Imaris. D) Data on all cell objects was exported into Excel, concatenated into a single CSV file, and imported into FlowJo for hierarchical population gating and analysis (top panels). Positional visualization of the gated cells, presented as density distributions, was also performed in FlowJo (bottom panels). E) Cell object gating and visualization was also performed in Imaris using Object Filters and gating thresholds from (D). All tissues were isolated from mice maintained at an Association for Assessment and Accreditation of Laboratory Animal Care-accredited animal facility at NIAID. All procedures were approved by the NIAID Animal Care and Use Committee (NIH).

