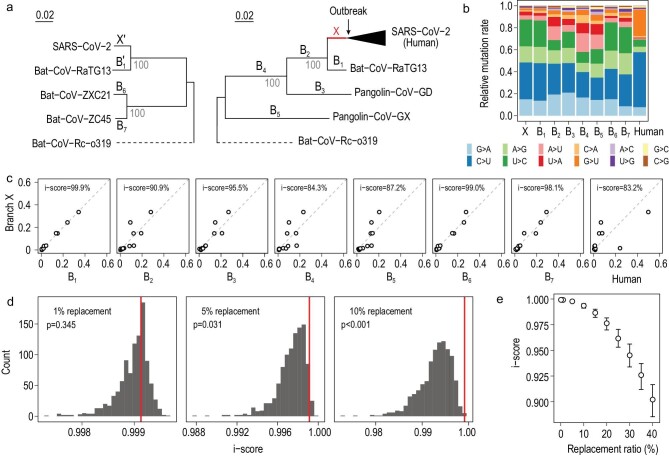
Figure 1.
Evolution of the mutation spectrum in the SARS-CoV-2 lineage. (a) The phylogenetic relationships of the seven coronaviruses included in the analysis. Two separate phylogenetic trees are considered to resolve the confusions caused by recombination, which results in different genealogical histories at different genomic regions in the ancestral branch of Bat-CoV-ZXC21 and Bat-CoV-ZC45. Nine major evolutionary branches examined in this study, X, B1–B7 and the human branch, are shown. Branch X and B1 are also present (as X′ and B1′) in the tree with B6 and B7 to help infer the ancestor of B6 and B7. Bat-CoV-Rc-o319 is used as an outgroup in both trees. (b) The relative mutation rate of the 12 mutation types on each of the nine evolutionary branches. (c) The similarity of mutation spectra between branch X and each of the other eight branches. The similarity of two branches is measured by identity score (i-score), which is the proportion of total rate variation explained by the x = y dimension in the plot of the two spectra. (d) The sensitivity of i-score between branch X and B1 to potential perturbations on X. Each histogram represents the result of 1000 replicates. The rate of replacements by random mutations is shown in each panel, with the red line showing the original i-score between X and B1, and the p showing the frequency of cases with an i-score larger than the original i-score. (e) The sensitivity of i-score under different replacement rates. The hollow point represents the median of 1000 replicates, and the error bar covers the upper and lower quartiles.

