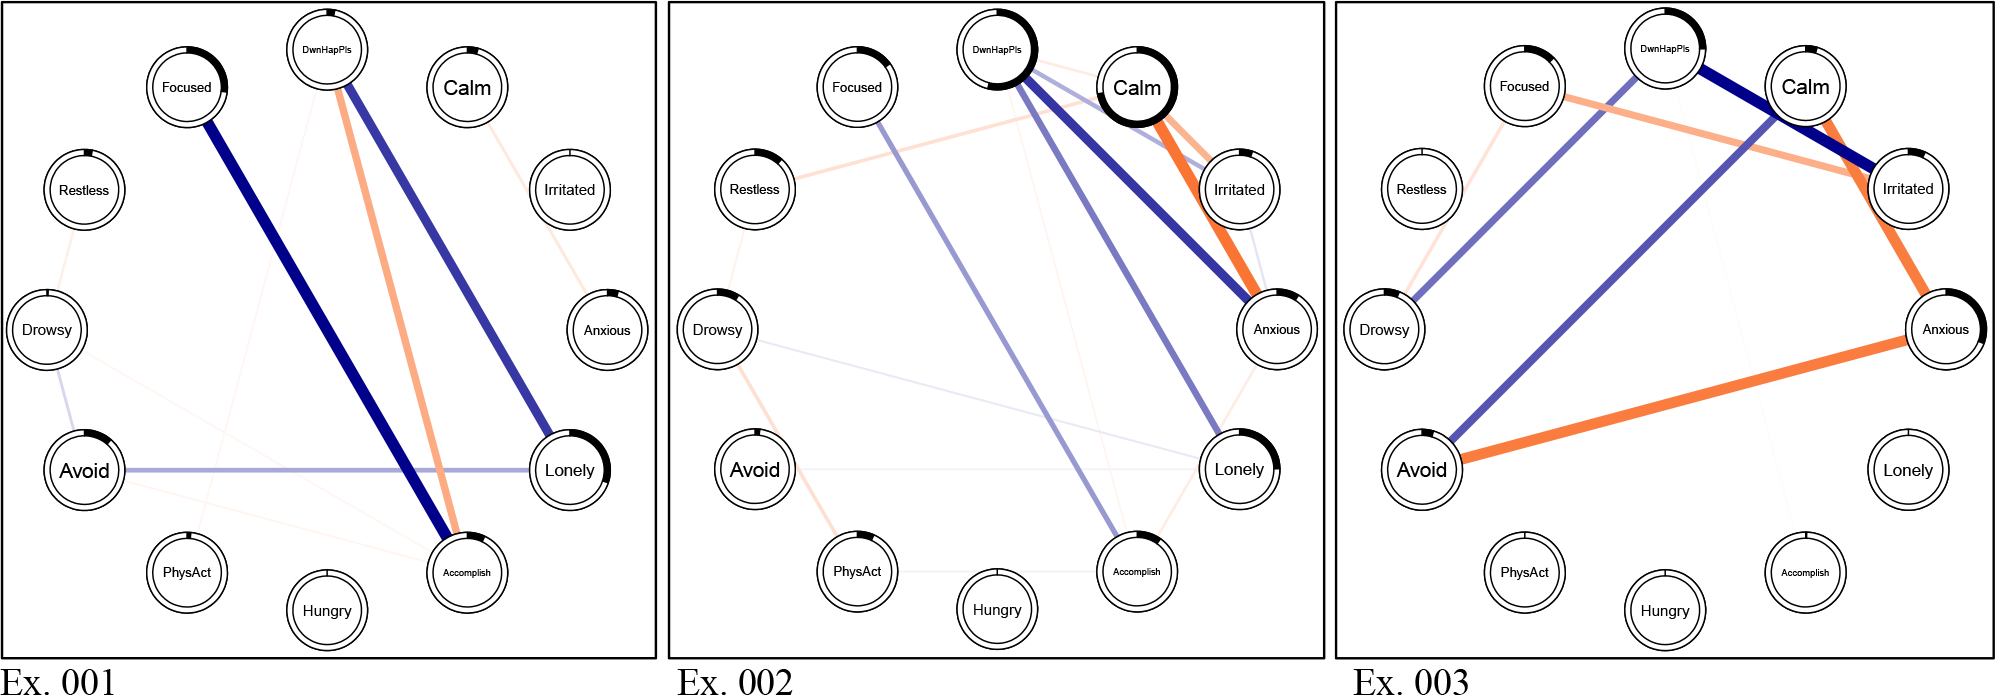
Figure 2. Contemporaneous person-specific models (graphicalVAR).

Note. The contemporaneous model demonstrates the individual-level partial associations from the person-specific VAR models for three exemplar participants. Dark blue pathways represent positive relationships; orange pathways represent negative relationships; the width of the line corresponds to the magnitude of the relationship. The extent to which the ring around each node is solid reflects the magnitude of the expected influence for each node – rings with more shading reflect nodes with larger expected influence on the network. Ex. = exemplar particiapnt; DwnHapPls = average composite of Down, Happy (reverse scored), and Pleased (reverse scored); Accomplish = Accomplished; PhysAct = Physical Activity; Avoid = Avoiding social situations.
