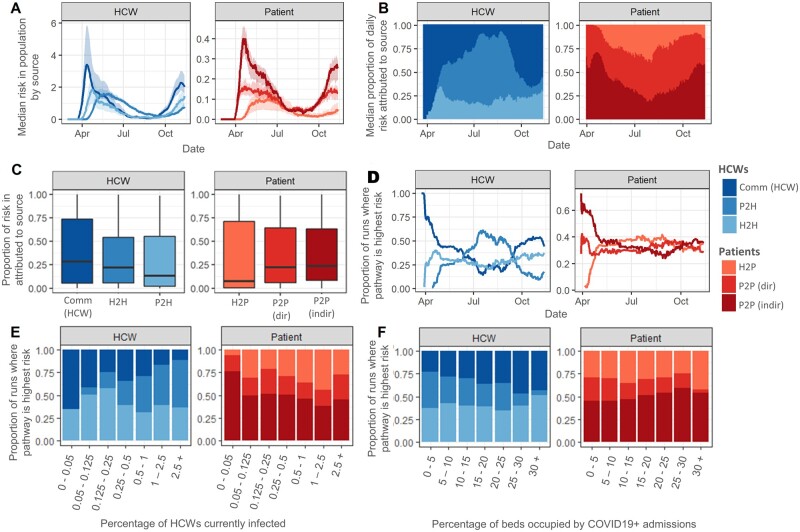
Figure 4.
Probability and risk of transmission to patient and healthcare worker (HCW) populations. (A) Median and 95% CI of the risk over time of transmission for each pathway under current interventions from 1000 model runs. (B) Median proportion of daily risk to HCWs and patients attributable to each source of infection. (C) Distribution of the proportion of risk attributed to each source for HCWs and patients over the entire simulation period. (D)–(F) Proportion of model runs in which each transmission pathway contributes the highest risk of transmission per day by date (D), on days on which the percentage of HCWs infected was with the range on the x-axis (E) and on days on which the percentage of beds occupied by COVID-19+ admissions was within the range on the x-axis (F). In all panels, risk is defined as transmission probability× number of susceptible individuals who could be exposed by that route; (e.g. for direct patient-to-patient transmission, where there is one infected patient and five susceptible patients in bay 1, the risk of a direct patient-to-patient transmission occurring in that bay is 1 × bP2P × 5, and the total risk of patient-to-patient transmission is the sum over all bays of bP2P × n_infected × n_susceptible in each bay).

