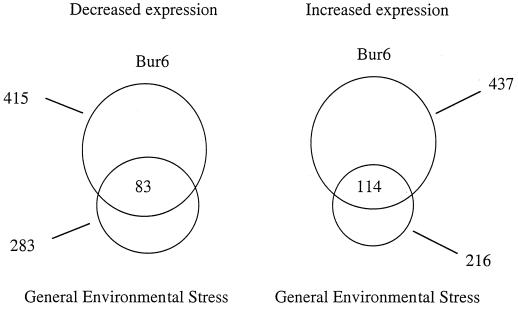
FIG. 5.
Relationship between Bur6 function and the response to environmental stress. Venn diagram indicating the number of genes that are increased or decreased at least twofold in cells in which Bur6 is thermally inactivated (top circles) or in cells subjected to a wide variety of environmental stresses (bottom circles). The number of genes affected by both conditions is indicated at the intersections.

