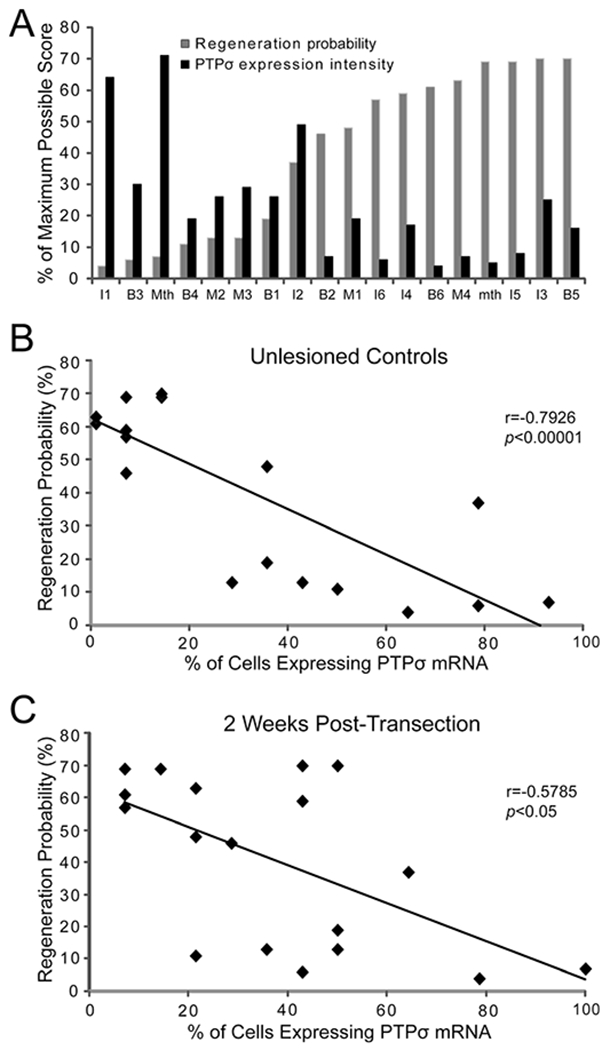
Figure 10.

Inverse relationship between PTPσ mRNA expression and probability of axon regeneration. A: Semiquantitative PTPσ expression levels and previously determined regeneration probabilities (Jacobs et al., 1997) of individual identified reticulospinal neurons. Because the difference in expression scores between control animals and those at 2 weeks post transection was not statistically significant, the scores for seven uninjured control animals and seven animals at 2 weeks post transection were pooled (n = 14). The maximum score for any neuron on the semiquantitative scale was 3. Thus the maximum possible cumulative score for the 28 members of any cell type in this pooled sample (2 cells per animal in 14 animals) was 84, and the score for each cell graphed in A was its cumulative score divided by 84. In B and C, the control animals and the animals at 2 weeks post transection were analyzed separately, and the % of each of the reticulospinal neurons expressing PTPσ mRNA was graphed as a function of that cell’s previously determined probability of regeneration Thus for any cell type, the maximum number of cells expressing PTPσ was 14 (2 cells per animal in 7 animals), and the percentage of cells represented in the graphs was the number of labeled cells divided by 14. B: The % of reticulospinal neurons expressing PTPσ in control animals was inversely correlated with the previously determined regeneration probability for each of these cells. C: PTPσ expression 2 weeks post transection was also inversely correlated with regeneration probability.
