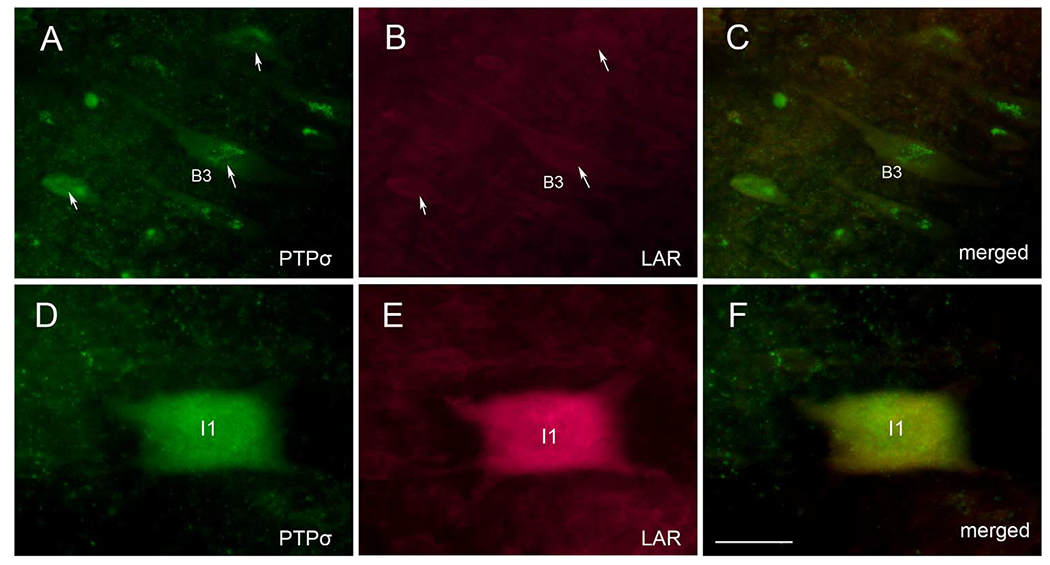
Figure 14.

Double labeling for PTPσ and LAR mRNA in lamprey brain 2 weeks after SC transection shows partial overlap. A: ISH for PTPσ. B: ISH for LAR. Arrows point to the neurons that express PTPσ in A but are negative for LAR in B. C: Overlay of A and B suggests absence of overlap among this group of neurons. D: An I1 cell that expresses PTPσ. E: The same neuron expresses LAR. F: Overlay of D and E. Scale bar = 80 μm in F (applies to A-F).
