Figure 5.

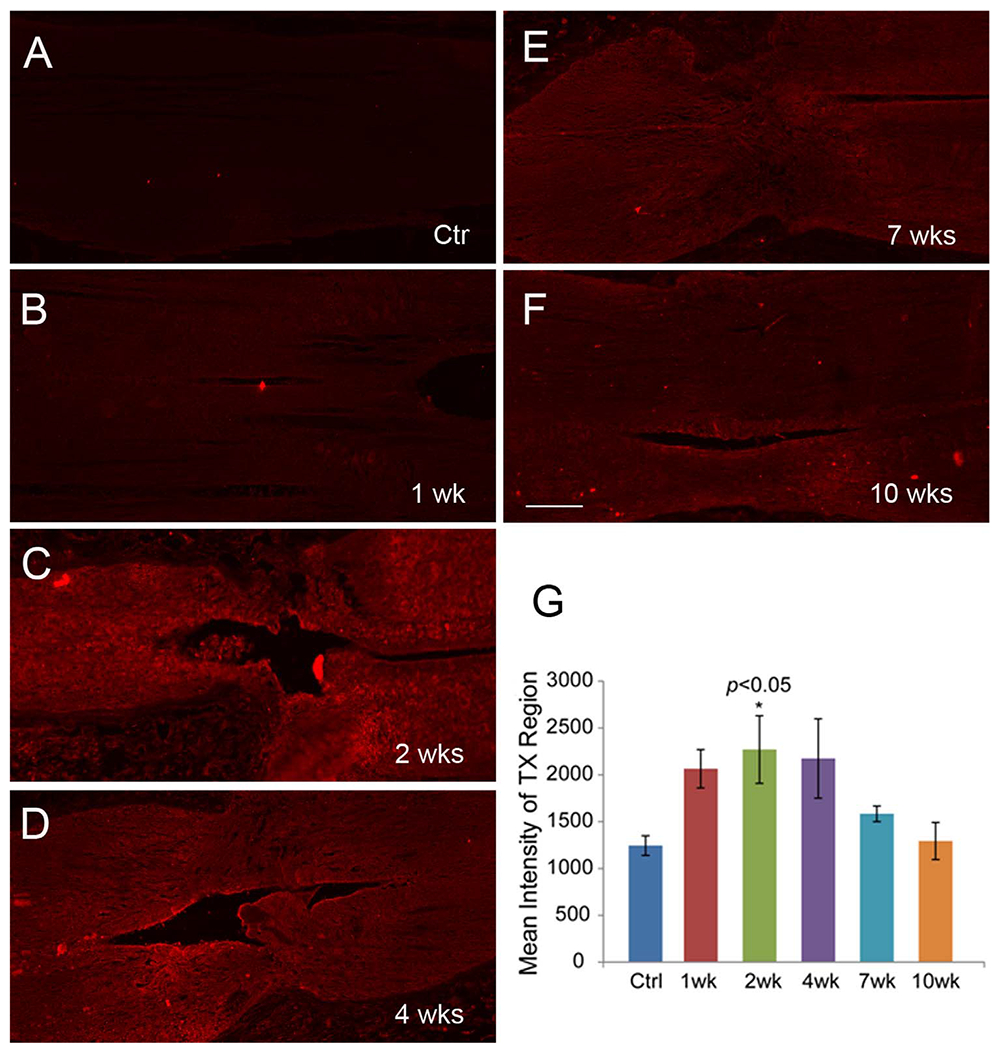
Distribution of CSPGs in the unlesioned control and transected lamprey spinal cords. A-F: CSPG immunostaining with the Cat-316 antibody in longitudinal sections spanning the transection site (arrows) in a control animal and at different post transection times, showing that expression reaches a peak at 2 weeks post transection and declines afterward. G: Intensity analysis of CSPG immunolabeling shows statistically significant increase at 2 weeks post transection compared with control (ANOVA and post hoc two-tailed t-test; n = 5 animals per group). Scale bar = 100 μm in F (applies to A-F).
