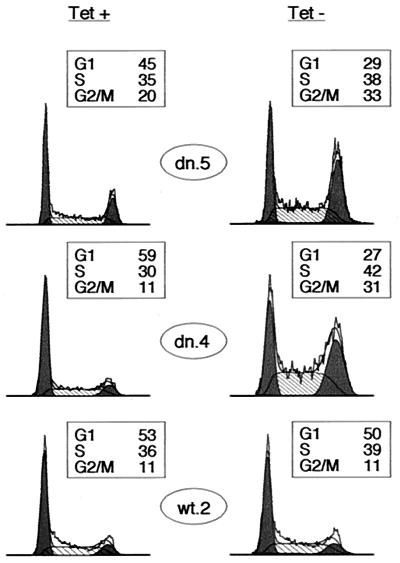
FIG. 2.
Cdk2-dn induction preferentially imposes S and G2/M arrests. Dn.5, dn.4, and wt.2 cells were grown in the presence (left) or absence (right) of Tet for 3 days, and the DNA content of the cells was assayed by flow cytometry. DNA content is displayed on the x axis, and cell number is shown on the y axis. For ease of presentation in all figures, DNA content profiles were normalized to the highest peak. G1 and G2/M fractions are shaded black, and S fractions are hatched. Boxed areas show the percentage of cells in each fraction.

