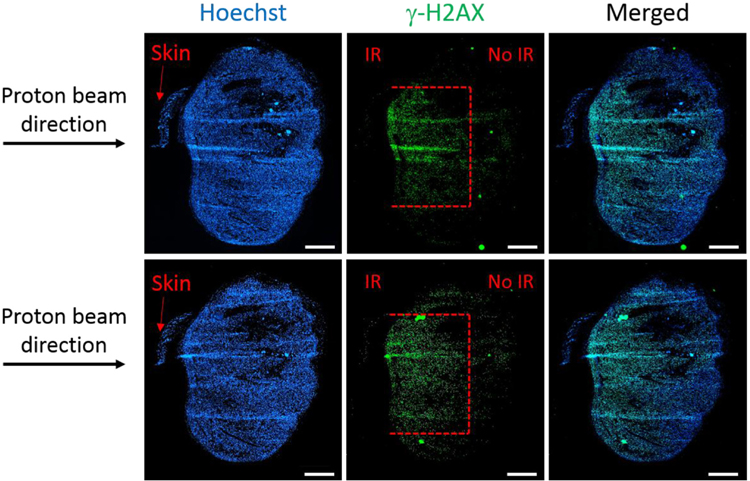
Figure 7.
γH2AX immunofluorescence staining in OCT-frozen B16F10 tumor sections (200 μm interval between sections) at 1 h post 4 Gy of proton irradiation. Damage (red dotted lines) to the tumor tissue covers 4–5 mm width, corresponding to the size of the collimator used (5 × 5 mm2) and 3 mm depth (Bragg peak). Magnification, ×10; scale bar, 1 mm.

