Figure 5.
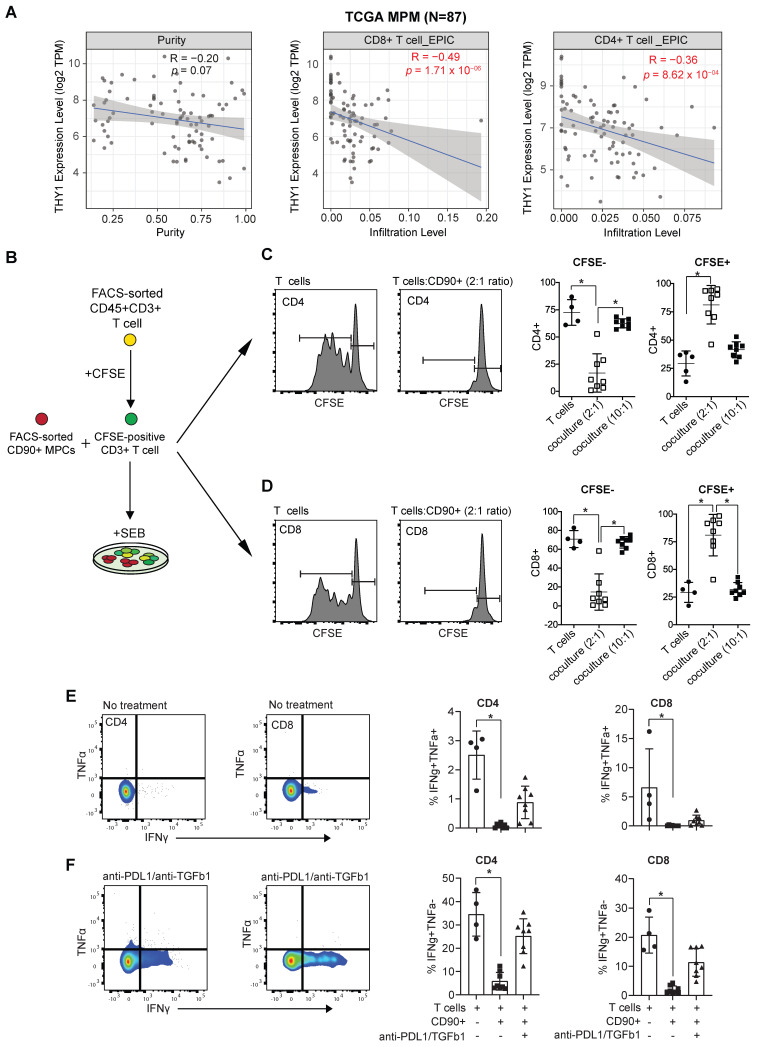
Immunosuppressive function of CD90+ MPC cells. (A) Correlative analysis (purity-adjusted spearman's R) between immune infiltration estimation (CD4+ or CD8+ T cells) and THY1 (encoding CD90) gene expression across TCGA MPM tumor samples. Immune infiltration profiles were estimated by EPIC algorithm 22. Data were from TIMER2.0 (http://timer.comp-genomics.org/), a comprehensive resource for systematical analysis of immune infiltrates across TCGA cancer types. (B) Schematic showing coculture experimental setup. (C, D) Representative flow cytometric histograms showing proliferation of CFSE-labeled CD4 (C) and CD8 T cells (D) isolated from the peripheral blood of a healthy donor 5 days following activation with staphylococcal enterotoxin B (SEB, 500 ng/mL) alone or in the presence of immune primed (IP) CD90+ MPCs cells at a 2:1 ratio. Scatter plots showing proliferation of CFSE-labeled CD4 and CD8 T cells cocultured with vehicle or IP CD90+ MPCs. For coculture conditions (n = 8) in total. (E, F) Representative bivariate plots showing TNFα and IFNγ expression in CD4 (E) and CD8 T cells (F) following activation with SEB (500 ng/mL) in the presence of IP CD90+ MPCs treated with vehicle (No treatment) or 10 ug/ml of anti-PD-L1 and 10 ug/ml of anti-TGF-β1. Scatter plots showing % of IFNγ+/TNFα+ and IFNγ+/TNFα- in CD4 and CD8 T cells. Data in C-F determined by flow cytometry and presented as mean ± SD. Significant differences calculated using one way ANOVA followed by post hoc Tukey's range test.

