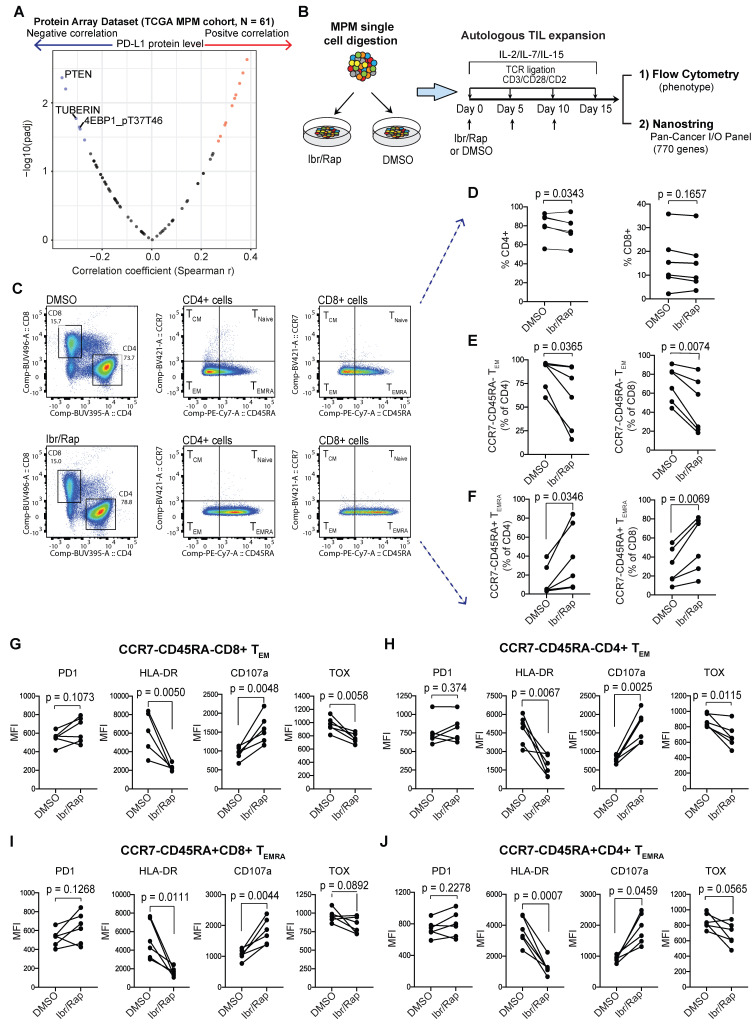
Figure 6.
Plasticity of MPM TILs. (A) Protein array dataset from TCGA MPM cohort showing proteins that are significantly correlated with PD-L1 protein expression. The plot shows proteins that negatively regulate PI3K-mTOR pathway are most enriched. (B) Graphical overview showing methodology of the experimental design used to expand T cells from digested MPM tumor samples, n = 8, biological replicates. (C) Representative bivariate flow plots comparing T cells subsets based on CCR7 and CD45RA expression in CD4 and CD8 T cells in DMSO (top panels) compared with Ibr/Rap (Ibrutinib and rapamycin) (bottom panels) treated samples in a matched patient. (D-F) Scatter plots showing change in frequency of CD4 and CD8 T cells (D), as well as CCR7-CD45RA-TEM (E), and CCR7-CD45RA+ TEMRA subsets (F) in CD4 and CD8 TILs treated with DMSO compared with Ibr/Rap. (G-J) Scatter plots showing change in frequency in several markers in both CD8 (G) and CD4 (H) CCR7-CD45RA-TEM subsets, and CD8 (I) and CD4 (J) CCR7-CD45RA+ TEMRA subsets. biological replicates (n = 8). Ibr/Rap, Ibrutinib (10 nm), Rapamycin (1 nm).

