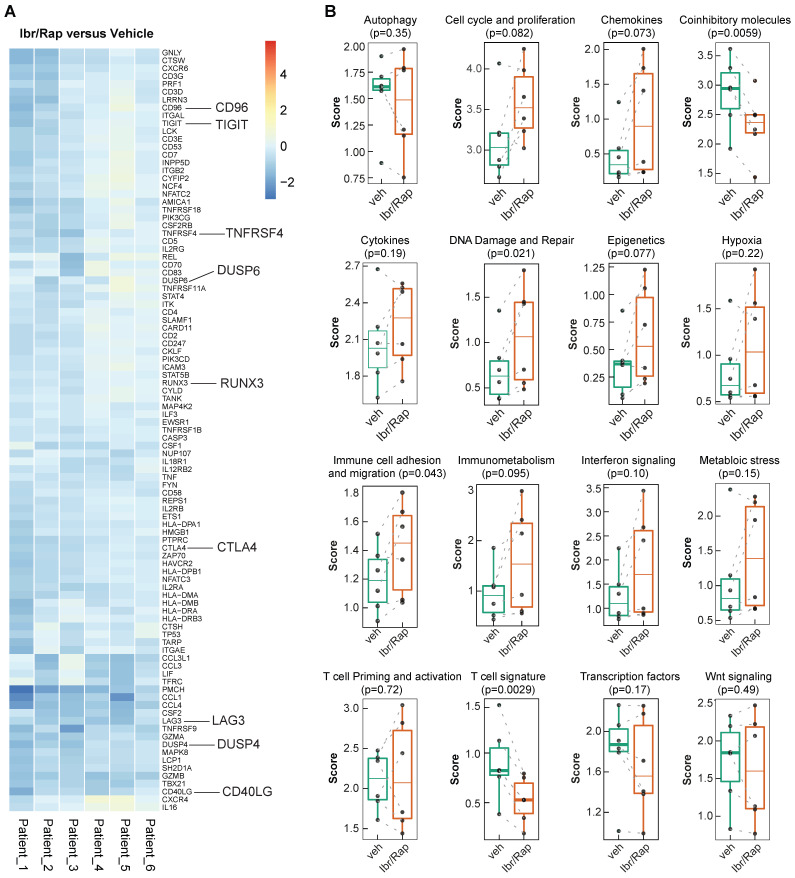
Figure 7.
Gene signature development in ex-vivo expanded TILs treated with Ibrutinib and rapamycin. (A) Heatmap of the top ranked genes expressed in TILs following expansion ex vivo in response to chronic TCR-dependent activation in the presence of Ibrutinib and rapamycin (Ibr/Rap) VS. DMSO vehicle. Each column represents an individual patient. (B) Box plots comparing the change in gene signature pathways between Ibr/Rap and Vehicle (DMSO) treated groups.

