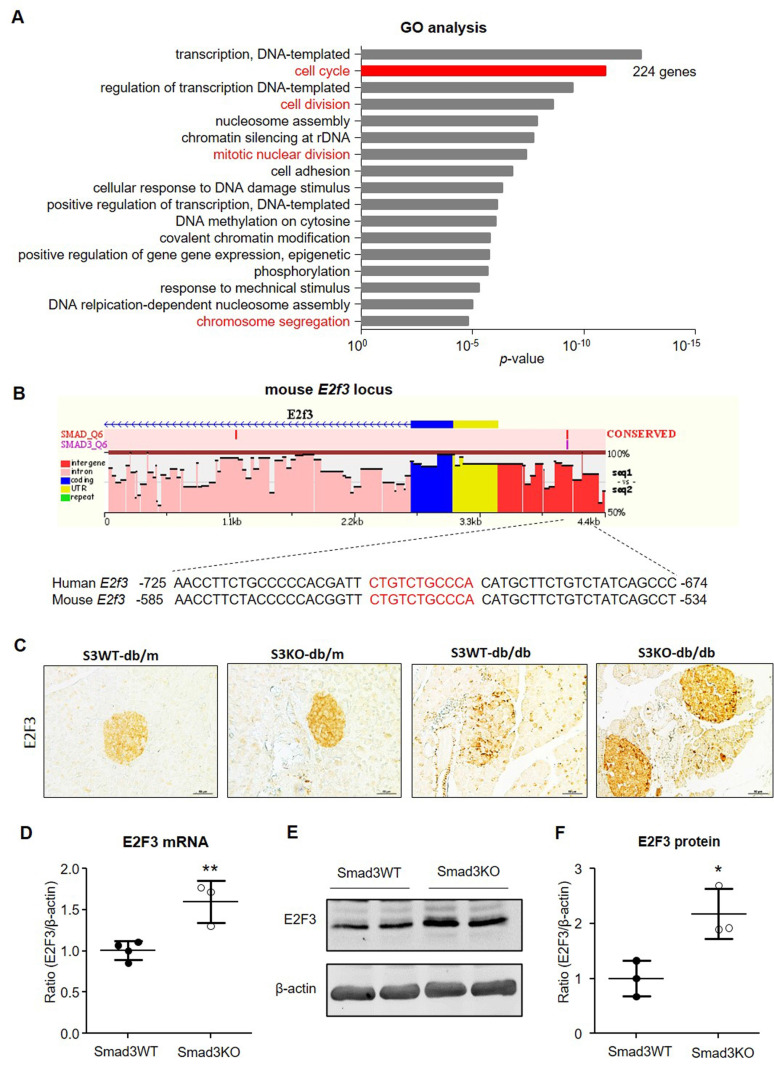
Figure 8.
Smad3 deficiency upregulates E2F3 expression in islets in vivo and in vitro. (A) GO analysis of DEGs in islets between Smad3WT-db/db and Smad3KO-db/db mice by RNA-seq. Genes with differential expression of equal or more than 2 folds are considered as DEGs (both upregulation and downregulation). Cell proliferation-related GO terms are marked in red. The total number of genes in the term of cell cycle is indicated on the right. (B) Cartoon to show the Smad3 binding site (nucleotides in red) on mouse E2F3 locus predicted by ECR browser software. (C) Immunohistochemistry detects the expression of E2F3 in pancreatic islets from mice of indicated genotypes. Scale bar, 50 μm. (D-F) Smad3KO and Smad3WT islet cells were cultured for 48 h followed by the analysis of E2F3 mRNA by RT-PCR and protein by Western blot. Each dot represents one independent cell culture and data are expressed as mean ± SD. *p < 0.05, **p < 0.01 compared with Smad3WT islet culture.

