Figure 3.
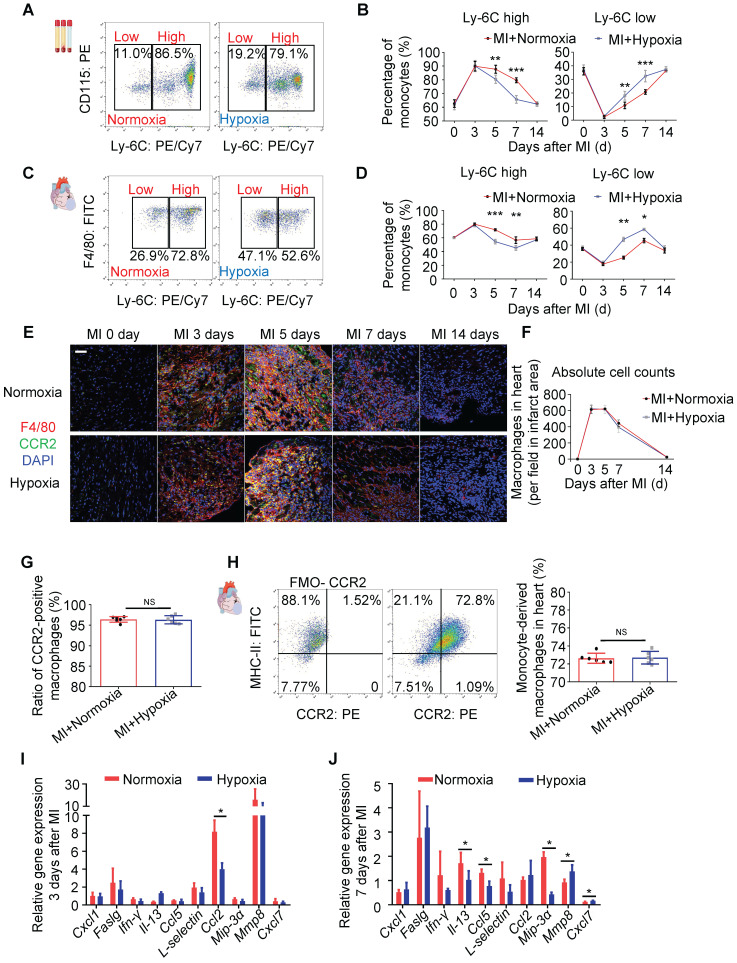
Systemic hypoxia promoted monocyte/macrophage phenotypic transitions. (A) Representative flow cytometric analysis of blood monocytes 5 days after MI under normoxia or hypoxia. (B) Ratios of Ly6Chigh and Ly6Clow blood monocytes among all blood monocytes (n=3 per group at each time point). (C) Representative flow cytometric analysis of tissue monocytes/macrophages 5 days after MI under normoxia or hypoxia. (D) Ratios of Ly6Chigh and Ly6Clow tissue monocytes among all monocytes (n=3 per group at each time point). (E) Representative immunofluorescence images of coimmunostaining with anti-CCR2 and anti-F4/80 antibodies within the infarct zone over 14 days in mice after LAD ligation. Scale bar: 50 μm. (F) Cell counts of macrophages in the infarct area in each field at various time points after MI in the normoxia or hypoxia group (n = 3 per group). (G) No difference was observed in the ratio of CCR2-positive macrophages in the MI mouse hearts between the hypoxia and normoxia groups. (H) Pooled flow cytometry data from infarcted mouse tissue revealed no difference in the CCR2+ macrophage population between the normoxia- and hypoxia-treated MI hearts. (I) Protein expression of inflammatory cytokines in the infarct zones of hearts treated with hypoxia 3 days after LAD ligation (n = 3 per group). (J) Protein expression of inflammatory cytokines in the infarct zones of hearts treated with hypoxia 7 days after LAD ligation (n = 3 per group). Dot-plots represent data from individual mice. Statistical significance was determined by a Mann-Whitney test (B, D, F, I, J) or unpaired t-test (H). NSP > 0.05, *P < 0.05, **P < 0.01 and ***P < 0.001 compared to the corresponding MI+normoxia group.

