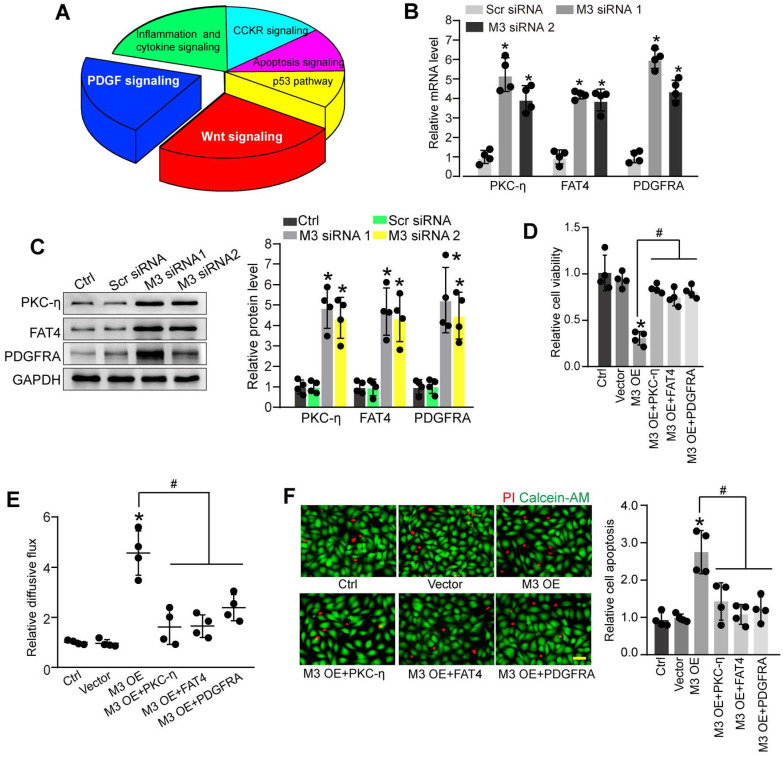
Figure 5.
Identification of the potential targets of METTL3 in pericytes. (A) KEGG pathway analysis was conducted to predict the potential signaling pathways regulated by METTL3 in pericytes. (B and C) Pericytes were transfected with scrambled siRNA (Scr siRNA), METTL3 siRNA1 (M3 siRNA1), METTL3 siRNA2 (M3 siRNA2), or left untreated (Ctrl) for 48 h. qRT-PCRs were conducted to detect the expression of PKC-η, FAT4, and PDGFRA in pericytes (B, n = 4, *P < 0.05 versus Ctrl group). Western blots were conducted to detect the levels of PKC-η, FAT4, and PDGFRA in pericytes. Representative blots and statistical results were shown (C, n = 4, *P < 0.05 versus Ctrl group). (D-F) Retinal pericytes were transfected with pcDNA 3.1 vector (Vector), pcDNA 3.1-METTL3 (M3 OE) without or with PKC-η, FAT4, or PDGFRA overexpression, or left untreated (Ctrl). These cells were exposed to 25 mM glucose for 48 h. MTT assays were conducted to detect cell viability (D, n = 4). The endothelial permeability was measured by FITC-Dextran transwell assay (E, n = 4). Apoptotic cells were determined by Calcein-AM/PI staining. Representative PI staining images at 48 h and statistical result were shown (F, n = 4, Scale bar: 20 µm). *P < 0.05 versus Ctrl group; #P < 0.05 versus M3 OE group; 1-way ANOVA, Bonferroni test.

