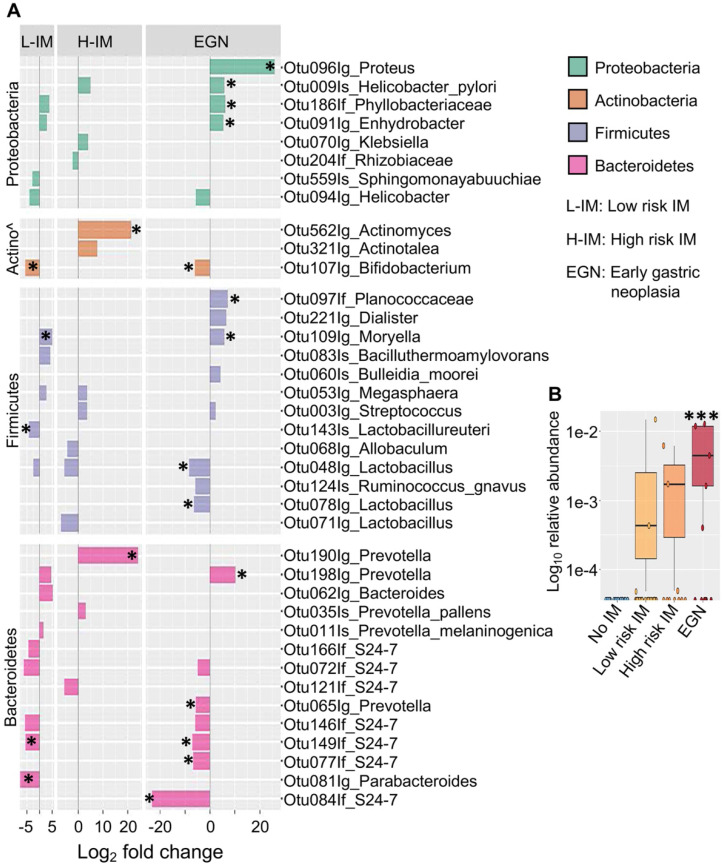
Figure 2.
Differentially abundant bacterial OTUs in patients with IM and EGN compared to patients with no IM. (A) Bar chart shows the log2 fold change (X-axis) differences in abundance of top bacterial taxa in low risk IM (L-IM), high risk IM (H-IM) or patients with dysplasia (EGN) compared to No IM group based on Deseq2 univariant analysis. All comparisons P < 0.05, *denotes Benjamini-Hochberg adjusted P (Padj) < 0.1. (B) Box and whiskers plot showing increased Proteus bacteria in patients with dysplasia compared to No IM patients. ***P < 0.0007, FDR = 0.1, multivariant test (MaAsLin2).

