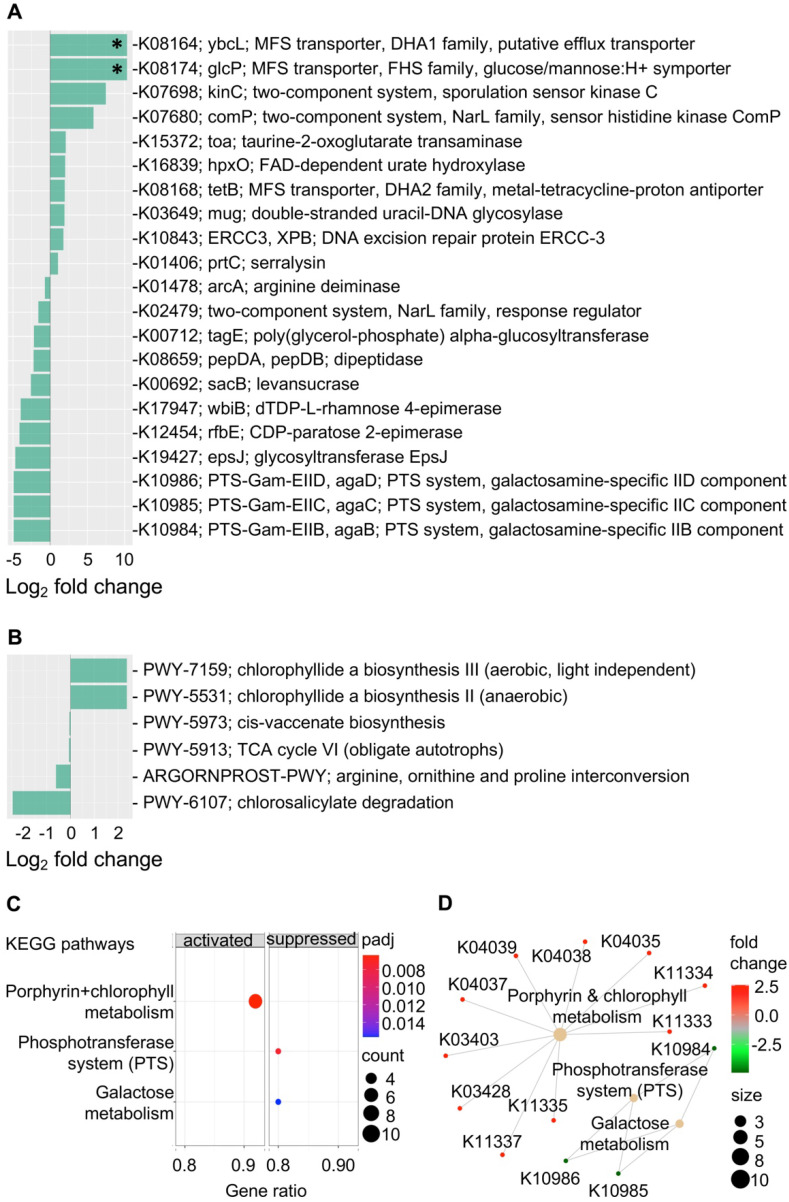
Figure 4.
Gastric mucosal-associated microbiome functions by PICRUSt2 based on bacterial 16S rRNA gene sequences. Bar plots show top differentially abundant (A) KEGG orthology (KO) features (P < 0.005) and (D) MetaCyc pathways (P < 0.05) in baseline samples from patients that progress to EGN and patients that do not progress. *denote Benjamini-Hochberg Padj < 0.01 (DESeq2). (C) Dot plot showing top enrichment KEGG pathways that were either activated or suppressed in samples from patients that progress to EGN compared to patients that do not. “padj” and “counts” denote Benjamini-Hochberg adjusted P values and gene counts respectively. (D) Network plot showing KOs features and linkages associated with the enriched KEGG pathways.

