Figure 6.
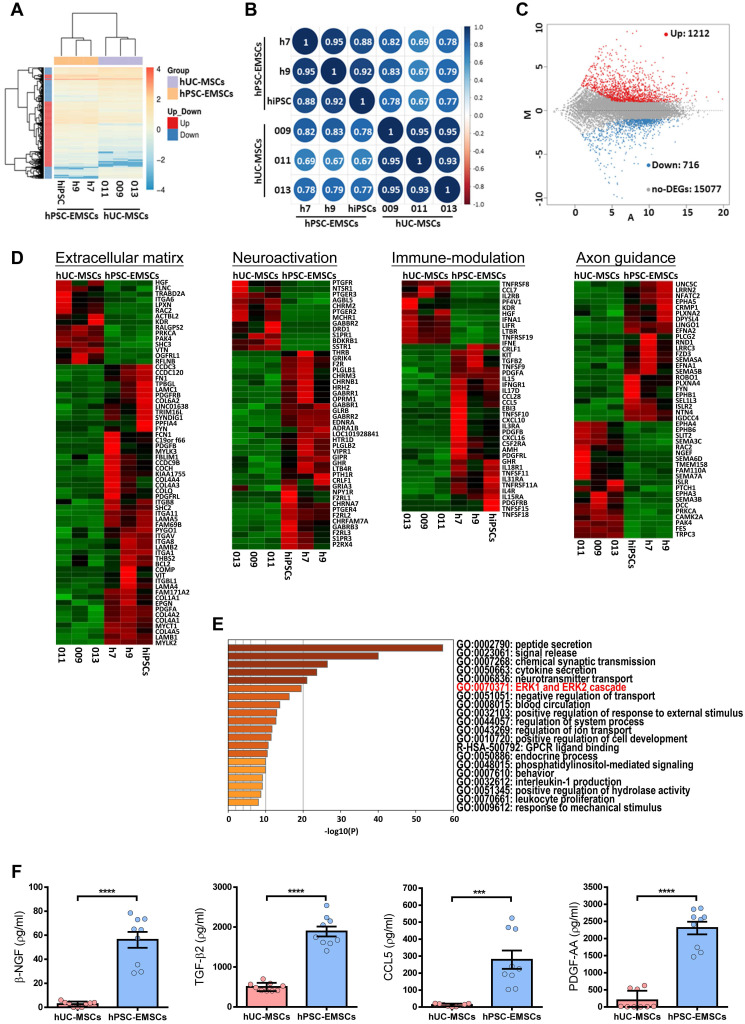
hUC-MSCs and hPSC-EMSCs exhibit different gene expression profile by RNA-seq analysis. A) Global gene expression profile analysis (hPSC-EMSCs (n = 3) Vs. hUC-MSCs (n = 3)) by RNA-seq indicated that hUC-MSCs and hPSC-EMSCs had different gene expression profiles from each other; B) Pearson's correlation analysis of hUC-MSCs and hPSC-EMSCs indicated that EMSCs derived from hPSCs was closely related to the EMSCs derived from hESCs and were distinct from hUC-MSCs. The correlation plot was generated using an online platform (http://www.bioinformatics.com.cn/); C) Comparison between hUC-MSCs and hPSC-EMSCs by MA plot indicated that 1212 genes were differentially upregulated and 716 genes were differentially downregulated in hPSC-EMSCs compared to hUC-MSCs (DEGs, Log2 Fold Change ≤ -1 or ≥ 1, P adj ≤ 0.05 or > 0.05); D) Heatmap analysis showing the differentially expressed genes associated with ECM, immunomodulation, neuroactivation and axon guidance between hUC-MSCs and hPSC-EMSCs; E) Gene ontology analysis of secretory factors (GO: 0032940) indicated that genes associated with ERK1 and ERK2 cascade were differentially expressed in hUC-MSCs and hPSC-EMSCs; F) ELISA analysis of β-NGF, TGF-β2, PDGF-AA and CCL5 in the CM derived from hPSC-EMSCs and hUC-MSCs. Three different EMSC-CM (from H7, H9 and iPSCs) and three UC-CM (from 009, 011 and 013) were used for the analysis. *** and **** represent p < 0.001 and 0.0001 respectively by Student T-test.

