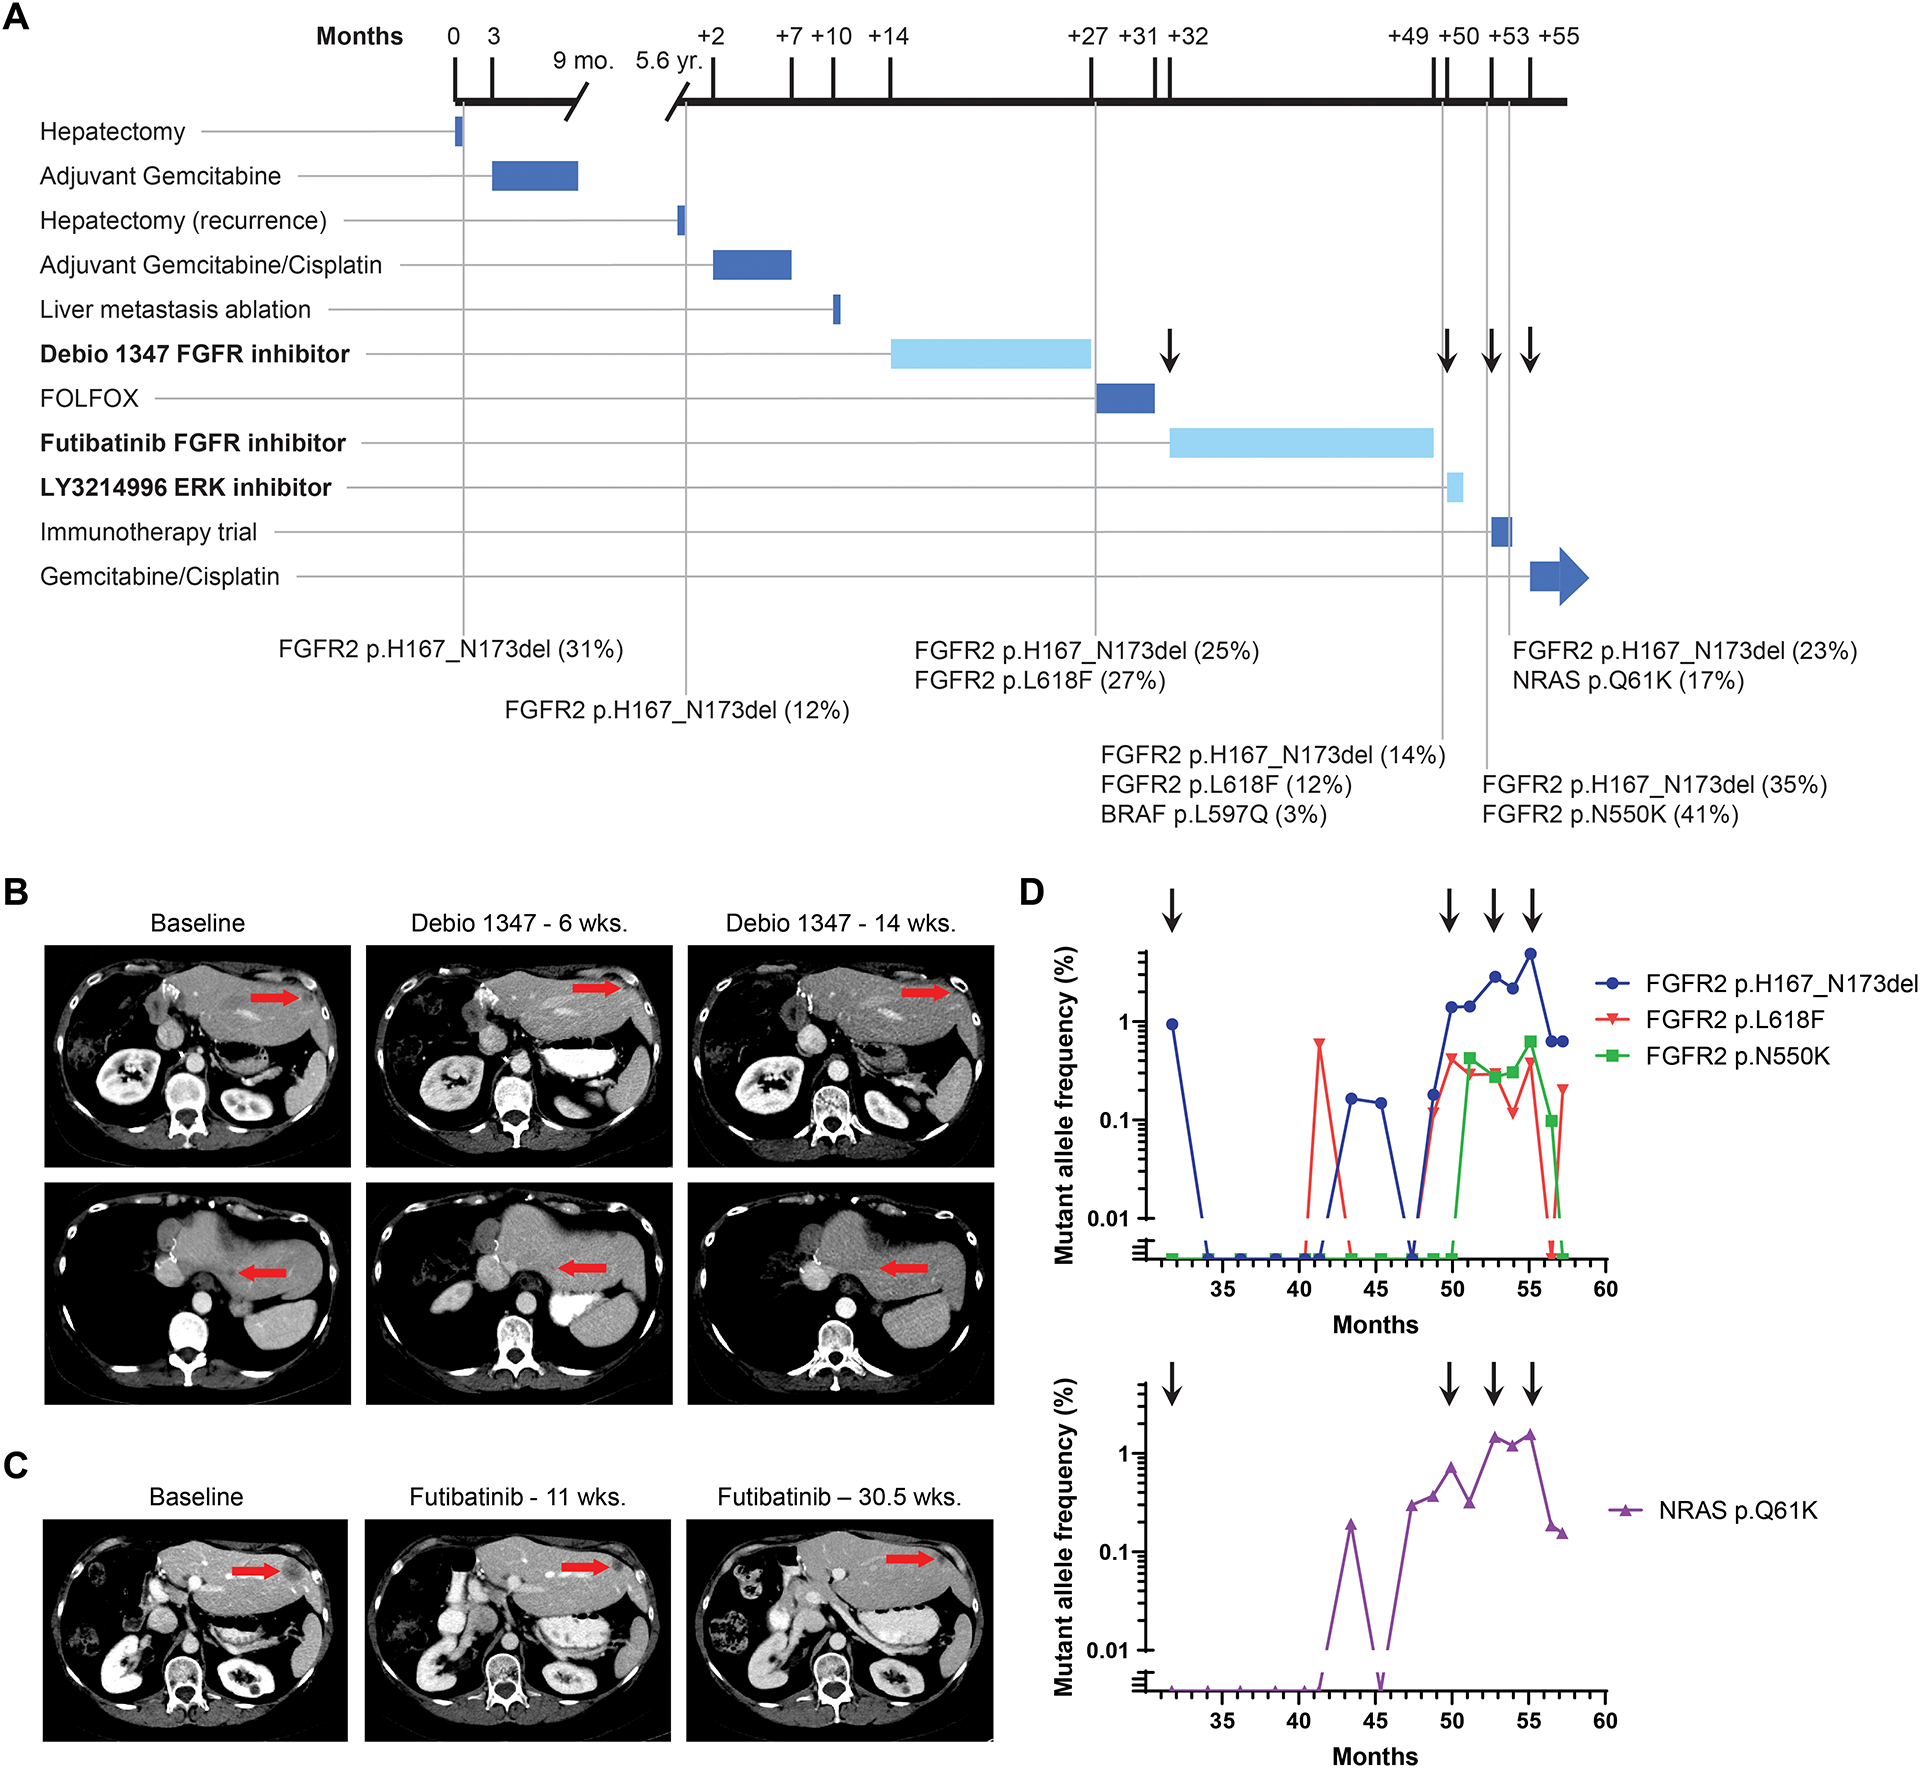
Figure 3: Treatment course for Patient 46 with intrahepatic cholangiocarcinoma and FGFR2 p.H167_N173del EID.

A. Timeline depicts patient’s treatment course and duration of therapy. Notable somatic mutations detected on liver biopsies (black vertical lines) are listed below the timeline. The mutation allele fraction (MAF) is listed as a percentage next to the genomic alteration. Arrows correspond to time points when a new treatment was started, in reference to droplet digital PCR analysis in panel D. Treatments with FGFR and MAPK targeted agents are highlighted in bold and duration delineated with a lighter blue color. B. Computed tomography (CT) scans demonstrating the patient’s liver lesions at baseline and after 6 and 14 weeks of Debio 1347 treatment. C. CT scans evaluating the patient’s liver lesions at baseline and after 11 and 30.5 weeks of futibatinib (TAS-120) treatment. D. Selected alterations identified retrospectively in circulating cell free DNA by droplet digital PCR of serially banked plasma samples. Arrows correspond to time points when a new treatment was started in the clinical timeline in panel A.
