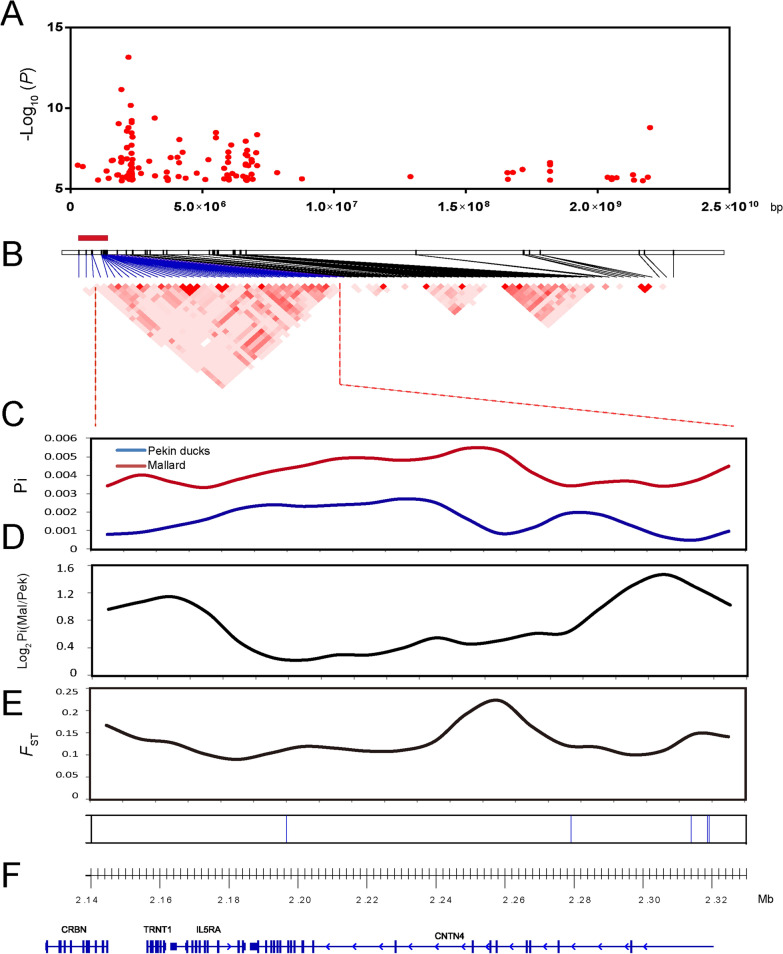
Fig. 2.
Analyses of the signatures of selection of the candidate region on chromosome 13 that affects FCR. a GWAS peaks located on chromosome 13. b Linkage disequilibrium (LD) of the significant SNPs. The red rectangle represents the region in LD with the leader SNP from the GWAS (Chr13:2,196,728, P = 7.05 × 10⁻¹⁴). c Average nucleotide diversities (Pi-value) of SNPs located in the sliding windows of the candidate region. d log2 Pi (mallard/Pekin duck) of the sliding windows. e Population differentiation analysis. f Each vertical blue line represents an SNP that reached the significance threshold of − log10 P = 8.16. The annotated genes are located in the candidate region according to the newly updated duck reference genome (IASCAAS_Peking Duck_PBH1.5, GCF_003850225.1)

