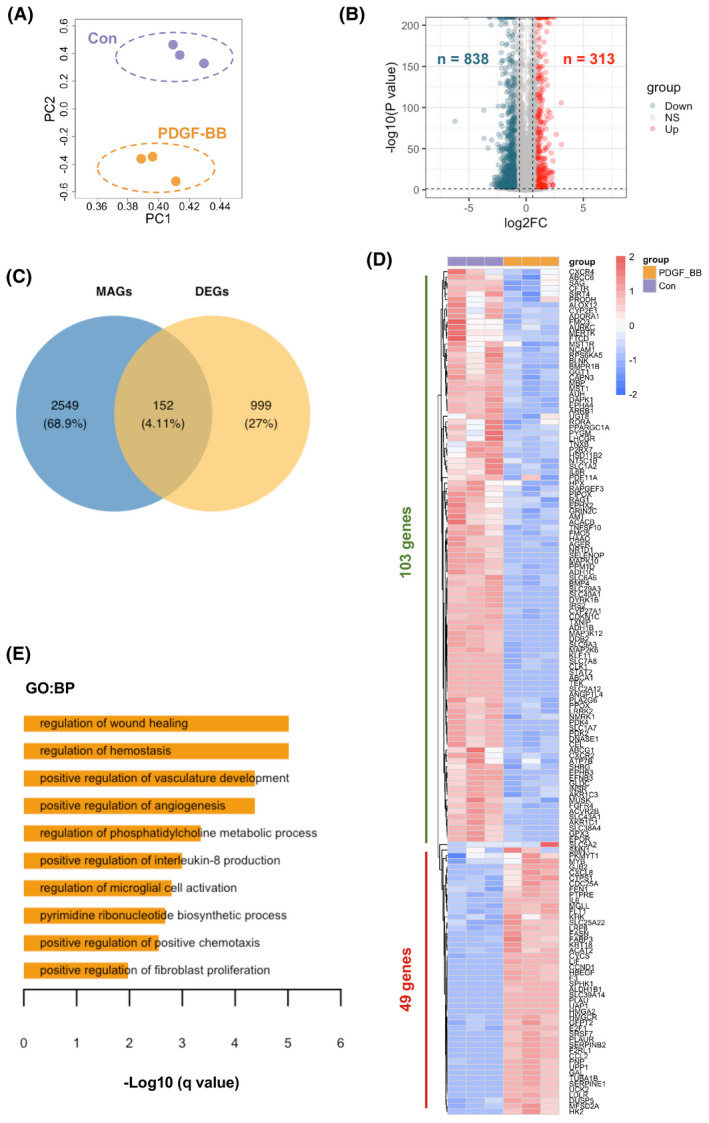
FIGURE 3.

Identification of metabolites associated DEGs in response to rhPDGF‐BB treatment and enriched pathways in hPASMCs. (A) Principal component analysis (PCA) demonstrated a well separated sample distribution of rhPDGF‐BB treated hPASMCs (PDGF‐BB) and control hPASMCs (Con) (n = 3 per condition). (B) 313 upregulated genes (red dots) and 838 down‐regulated metabolites (dark green) were identified and visualized in volcano plot (Fold change >2 or <0.5 and p < .05). (C) 152 overlapped metabolites associated genes (MAGs) and DEGs between PDGF‐BB group and Con group were visualized in Venn diagram. (D) Expression of 152 overlapped genes (49 upregulated and 103 downregulated genes) were visualized in heatmap in rhPDGF‐BB treated hPASMCs and control hPASMCs. (E) The enriched GO ontology (biological processes) of 49 upregulated genes were identified by functional annotation tool Metascape and visualized in bar plot
