FIGURE 4.

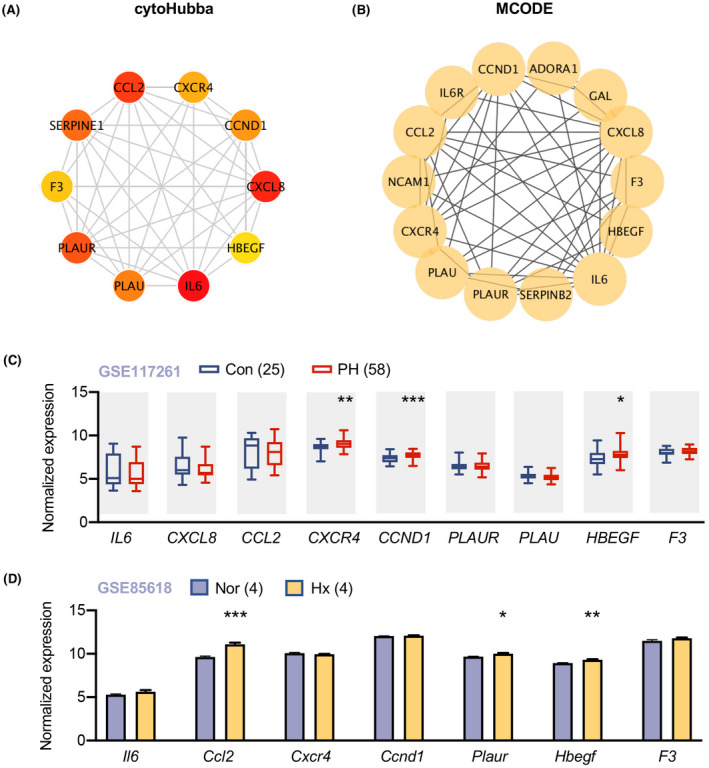
Identification of proliferation associated hub genes and validation in lungs of PH patients and PH rat models. (A) Identification of 10 hub genes by cytoHubba in Cytoscape; each circle represents unique gene and the redder the color is, the higher the MCC score is. (B) Identification of 14 hub genes by MCODE in Cytoscape; each circle represents unique gene. (C) Expression of 9 shared hub genes in lungs of 58 patients with pulmonary hypertension (PH) and 25 control subjects from GSE117261 were visualized in box plot. Data represent mean ± SEM. *p < .05, **p < .01, ***p < .001 compared to corresponding control subjects, as analyzed by unpaired t test. (D) The expression of hub genes in lungs of rats under hypoxia for two weeks or in normoxic condition (n = 4 per group). Data represent mean ± SEM. *p < .05, **p < .01, ***p < .001 compared to control rats, as analyzed by unpaired t test
