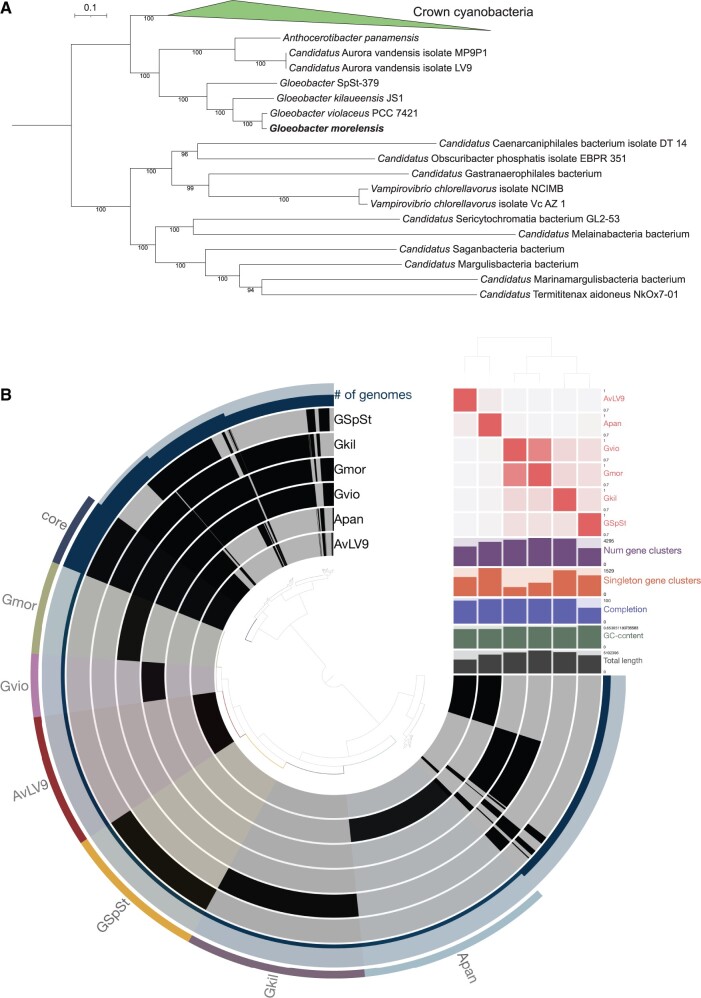
Fig. 1.
(A) Phylogenomic tree displaying placement of Gloeobacter morelensis with closely related lineages. Only the names of Gloeobacter-associated lineages and members of the outgroup are shown. Full tree with names of all lineages can be found in supplementary figure S1, Supplementary Material online. (B) Pangenomic comparison of three complete genomes and a draft genome of Gloeobacter species using the Anvi’o tool. Core gene clusters shared by all species are highlighted and labeled as “core” and gene clusters present in each species are highlighted and labeled as “Gmor,” “Gvio,” “AvLV9,” “GSpSt,” “Gkil,” and “Apan” to represent G. morelensis, G. violaceus, A. vandensis LV9, G. SpSt-379, G. kilaueensis, and A. panamensis, respectively. ANIs between them are shown as a heatmap in red near the top right quadrant of the figure. Placement of the genomes is based on ANI similarities as predicted by the PyANI tool.

