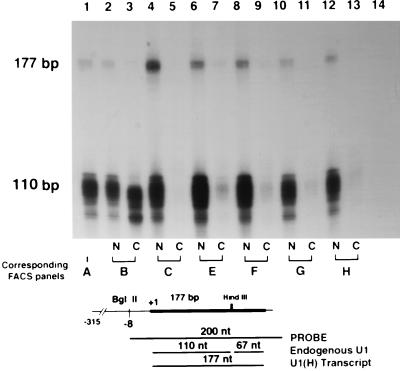
FIG. 8.
RNase protection assay showing the relative amount of U1 antitarget RNA in the nuclear (N) and cytoplasmic (C) mRNA from clonal populations of stably GFP-expressing cells subsequently transfected with U1 snRNA or U1(H) anti-GFP (Fig. 4C). The U1(H) snRNA transcript is a 177-nt band, and the endogenous U1 snRNA transcript is a 110-nt band. The two controls are in lane 1 (total NIH 3T3 RNA) and lane 14 (tRNA). Lanes 2, 4, 6, 8, 10, and 12 contain nuclear RNA, and lanes 3, 5, 7, 9, 11, and 13 contain cytoplasmic RNA. The following clones are those described in the FACS analysis in Fig. 4C: clone B, GFP-expressing cells (lanes 2 and 3); clone C, U1(H) snRNA (lanes 4 and 5); clones E to H, U1(H) anti-GFP (in lanes 6 and 7, 8 and 9, 10 and 11, and 12 and 13, respectively). The appearance of a U1 transcript in lane 3 (clone B cytoplasm) probably represents contamination of the sample with nuclear RNA, as suggested by its smaller size.

