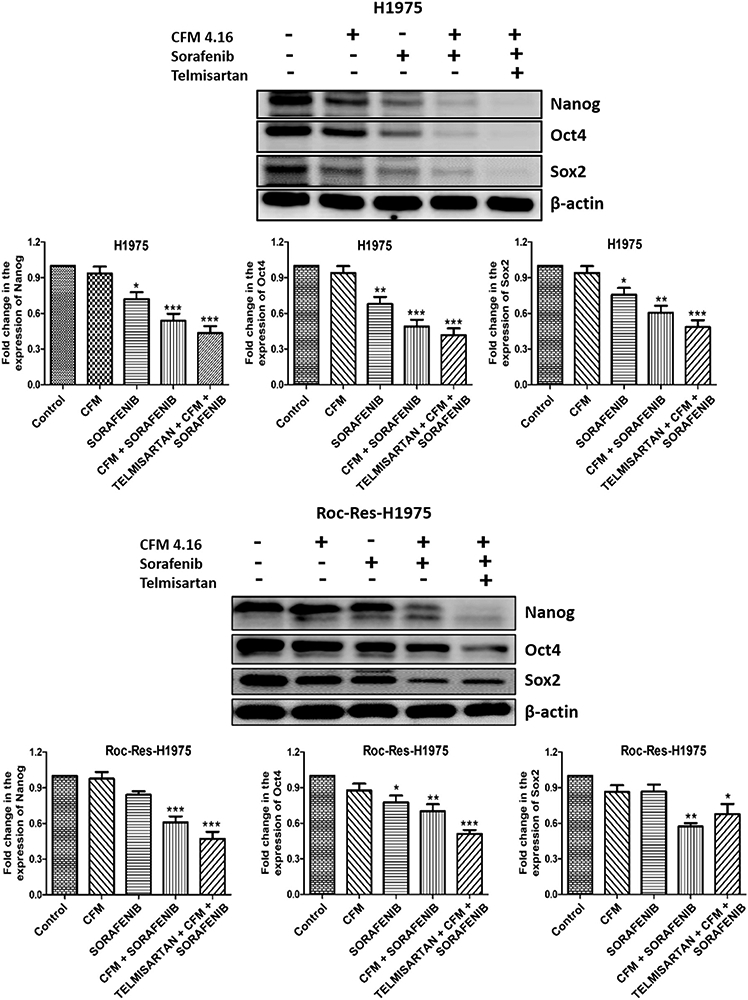
Figure 2.

Western blots and densitometric analysis of Nanog, Oct4 and Sox2 in H1975 and Rociletinib resistant H1975 cells. Data are representative of three different experiments and were presented as mean, and error bars refer to SEM. *p<0.05, **p<0.01, ***p<0.001 was considered significant when compared to control.
