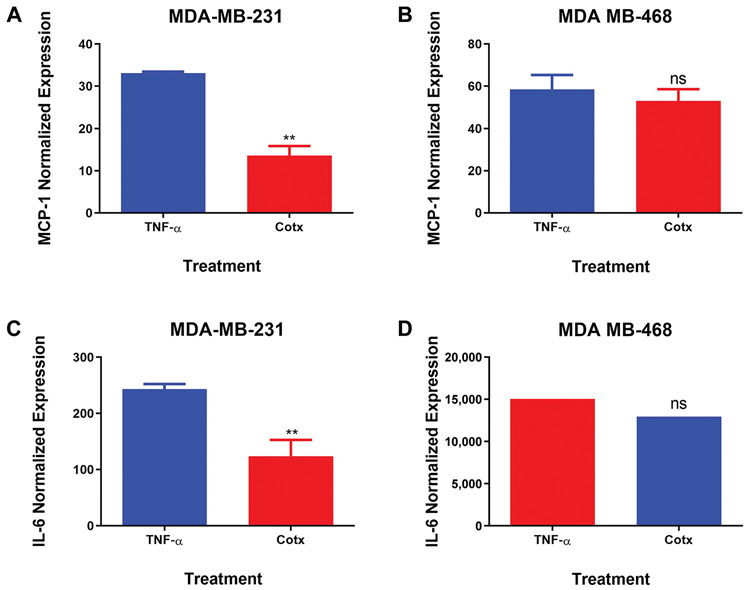
Figure 4.
Normalized protein expression of CCL2/MCP-1 and IL-6 in MDA-MB-231 (A and C) and MDA-MB-468 (B and D) triple negative breast cancer cells. Data represent normalized dot spot intensities from the cytokine arrays based on the positive controls found in each of the membranes’ corners using RAYBIO®ANALYSIS software (RayBiotech). Data are expressed as % of control (mean±S.E.M. n=3), representing treatment with TNF-α (40 ng/ml) and co-treatment with DATS (75 μM)+TNF-α (40 ng/ml). Student’s t-test evaluated the statistically significant differences between TNF-α vs. co-treatment, with **p<0.01. NS: Non-significant.

