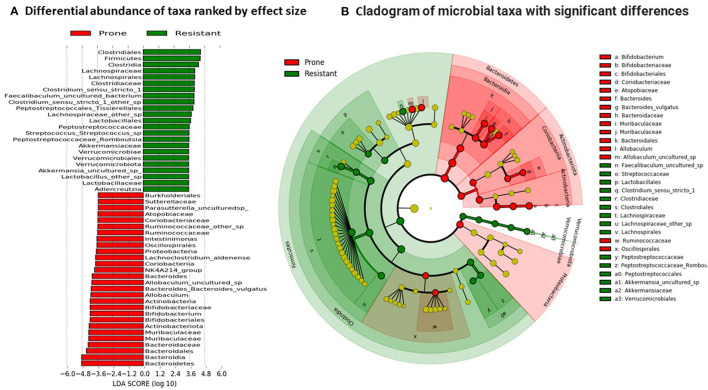
Figure 7.
Linear discriminant analysis. (A) Differential abundance of taxa was ranked according to their effect size between OP and OR rats. Selection of discriminative taxa between groups were based on an LDA score cutoff of 3.0 and differences in the relative abundances of taxa (converted to log base 10) were statistically determined based on a Kruskal–Wallis and pairwise Wilcoxon tests. A p-value of < 0.05 and a score ≥ 3.0 were considered significant in Kruskal–Wallis and pairwise Wilcoxon tests, respectively, at a significance level of 0.05; n = 24. The length of the histogram represents the LDA score; i.e., the degree of influence of species with significant difference between different groups. (B) The red or green shading depicts bacterial taxa that were significantly more abundant in either the OP or OR groups, respectively. The yellow circles on the cladogram depict bacterial taxa that were not significantly different or changed. Selection of discriminative taxa between groups were based on an LDA score cutoff of 3.0.

