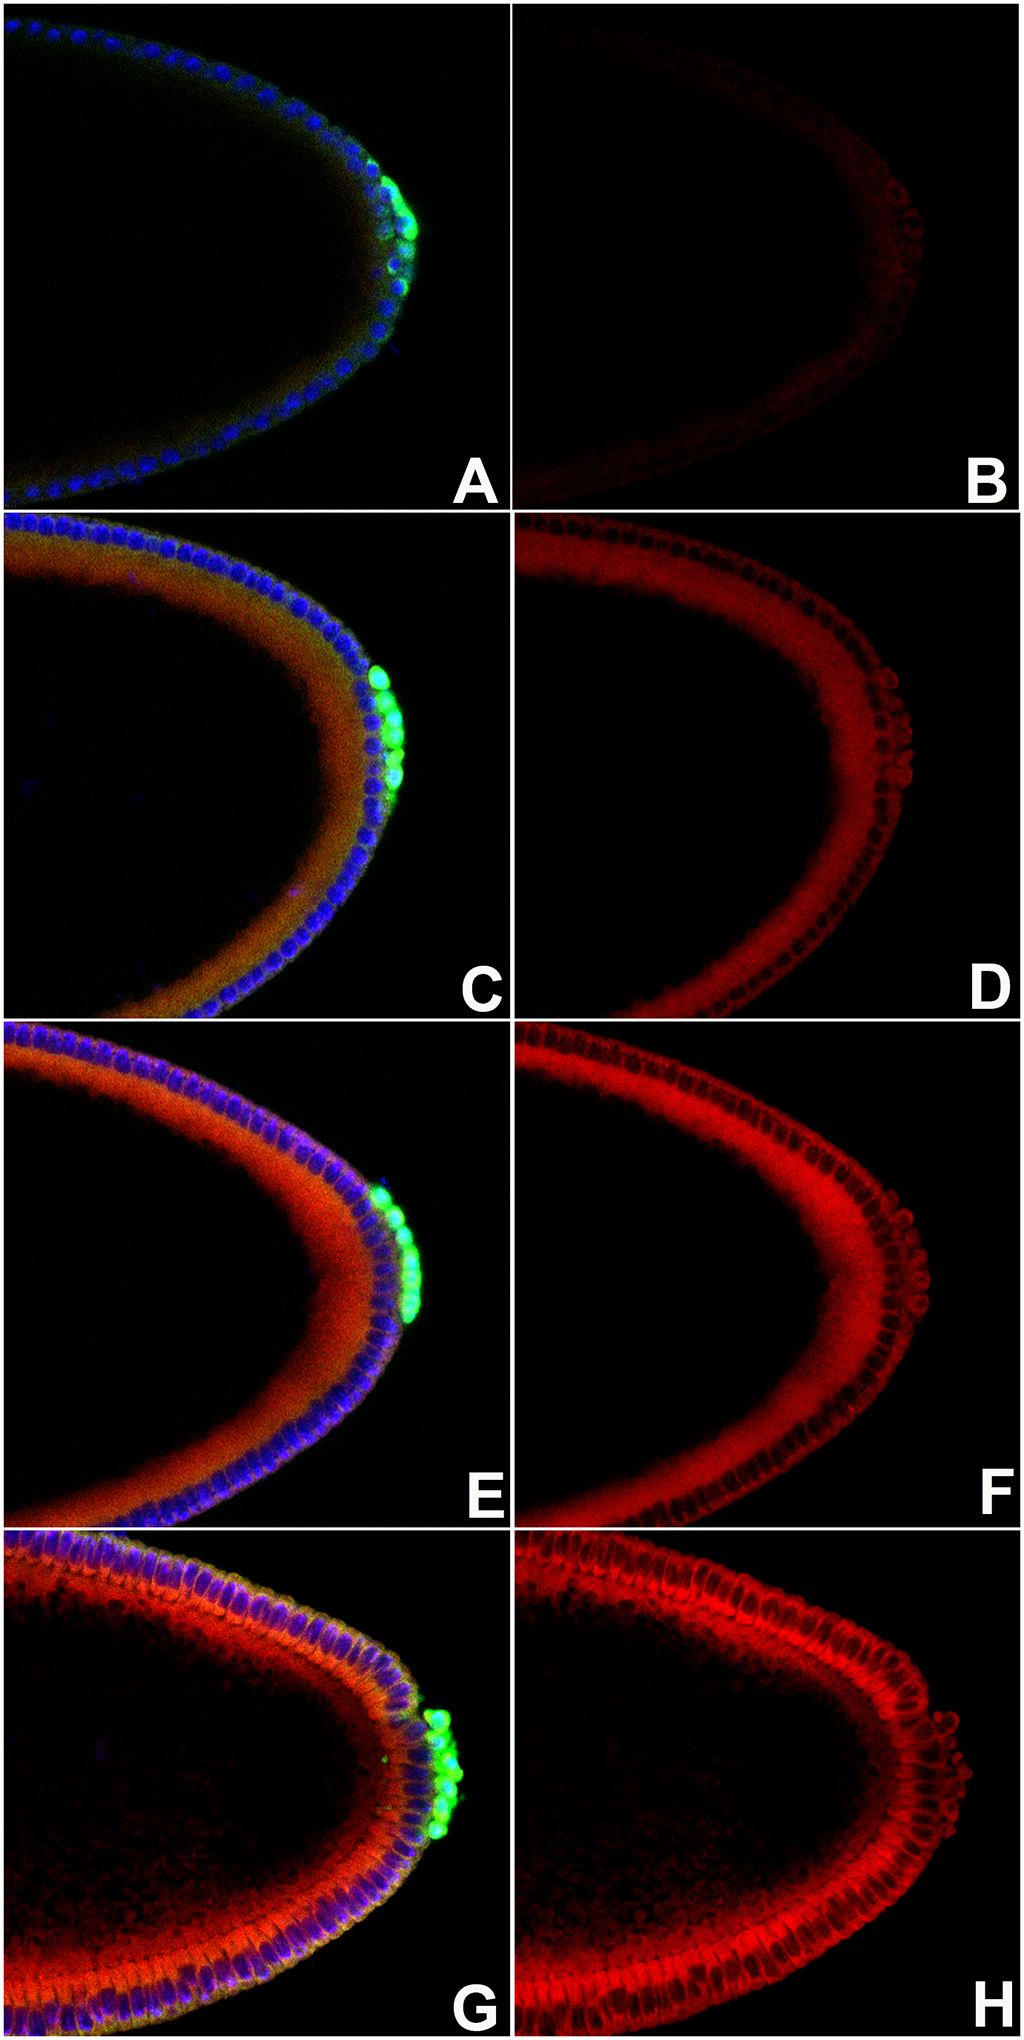
FIGURE 1. ROS levels steadily increase in early stage Drosophila embryos.

WT embryos were stained with anti-Vasa antibody (green), DNA marker Hoechst (blue). Left-hand panels (Composite panels: A, C, E, G) and ROS detector dihydroethidium DHE (red). Right-hand panels (B, D, F, H) show just the DHE signal. Embryos are oriented anterior to the left and dorsal side on top in all panels.
A, B. Stage 3 WT embryos. Somatic nuclei and pole buds show little to no accumulation of ROS.
C, D. Early stage 4 WT embryos show modest enhancement in ROS levels across the embryo compared to earlier stage.
E, F. Somatic nuclei and PGCs of late syncytial blastoderm stage WT embryos show progressive increase in the ROS levels as compared to early stage 4 WT embryos.
G, H. Somatic cells and PGCs of cellular blastoderm WT embryos show readily detectable increase in ROS levels.
