Fig. 2.
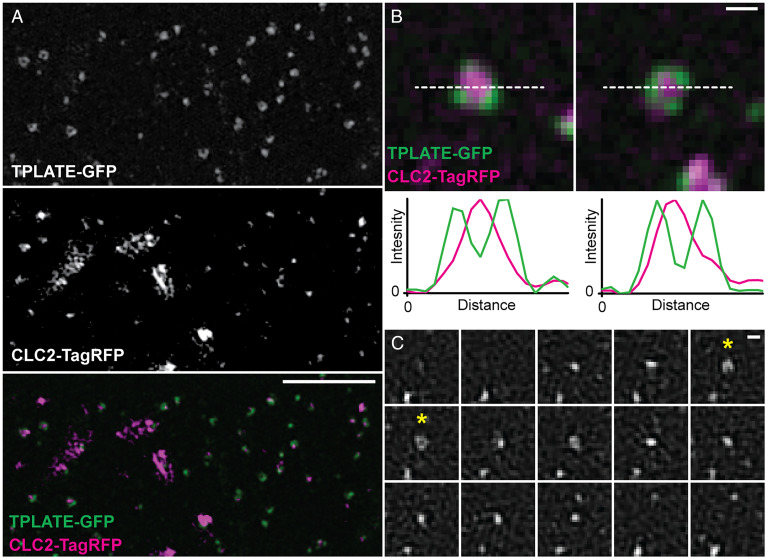
The TPC is localized at the rim of CME events. (A) Representative 3D SIM image of an Arabidopsis root epidermal cell expressing TPLATE-GFP and CLC2-TagRFP. (B) Examples of individual endocytosis structures and line plots (white dotted line) of their fluorescent intensities. (C) TIRF-SIM example of TPLATE-GFP dynamics in an Arabidopsis root epidermal cell (see Movie S1 for a larger field of view). Asterisks note when a ring structure is formed. Frame interval is 5 s. (Scale bars, A, 3 µm; B and C, 200 nm.)

