Fig. 3.
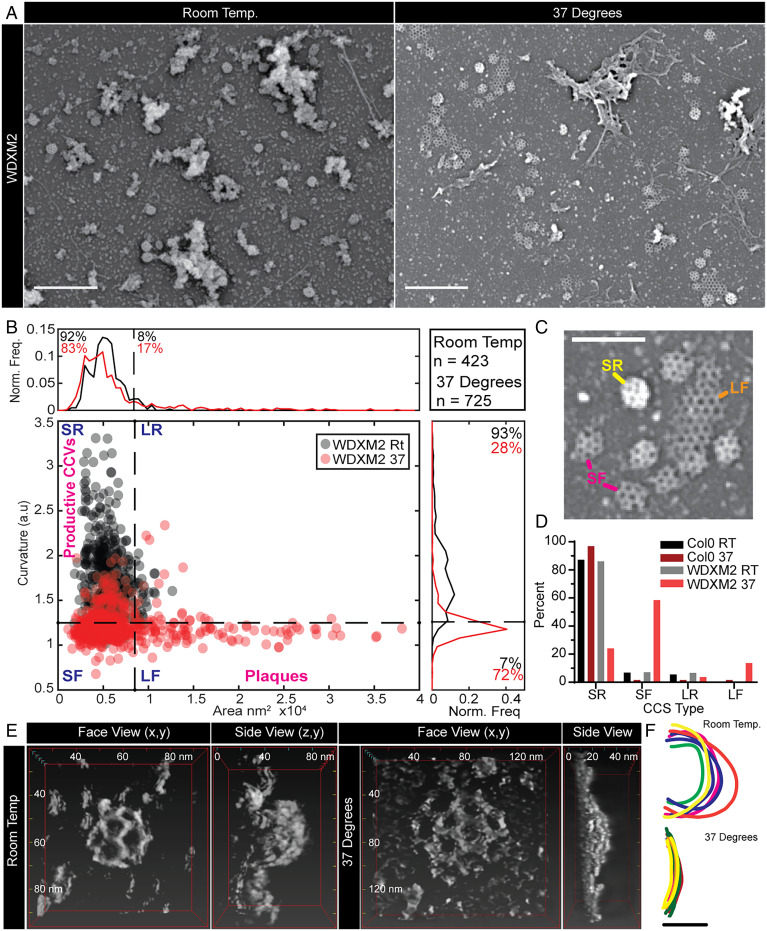
TPC disruption prevents membrane bending during plant CME. (A) SEM of metal replicas of unroofed WDXM2 root protoplast cells. (B) Scatter plot of the area and curvature of CCSs in WDXM2 cells incubated at room temperature (RT) (gray dots) or 37 °C (red dots) for 4 h. The graph is divided into four sections in order to classify the CCSs based on their shape: SR (small and round), SF (small and flat), LR (large and round), and LF (large and flat, plaques). The small/large threshold is based on an area of 105-nm diameter, and the round/flat threshold was based on measurements made of clathrin plaques observed in TPC disruption conditions (e.g., “LF” example in C). (C) Example CCSs of these classifications. (D) Percentage populations of these classifications in wild-type (Col-0) and WDXM2 cells subjected to RT or 37 °C incubations. Data pooled from multiple experiments; n = Col-0 RT, 3 and 588 CCSs; Col-0 37 °C, 4 and 127 CCSs; WDXM2 RT, 6 and 423 CCSs; and WDXM2 37 °C, 3 and 725 CCSs. (E) Reconstructions of example STEM tomograms of clathrin structures in unroofed WDXM2 cells incubated at either RT or 37 °C. (F) Tracings of reconstructions overlaid each other. n = RT, 6; 37 °C, 8. (Scale bars, A, 500 nm; C, 200 nm; F, 50 nm.)

