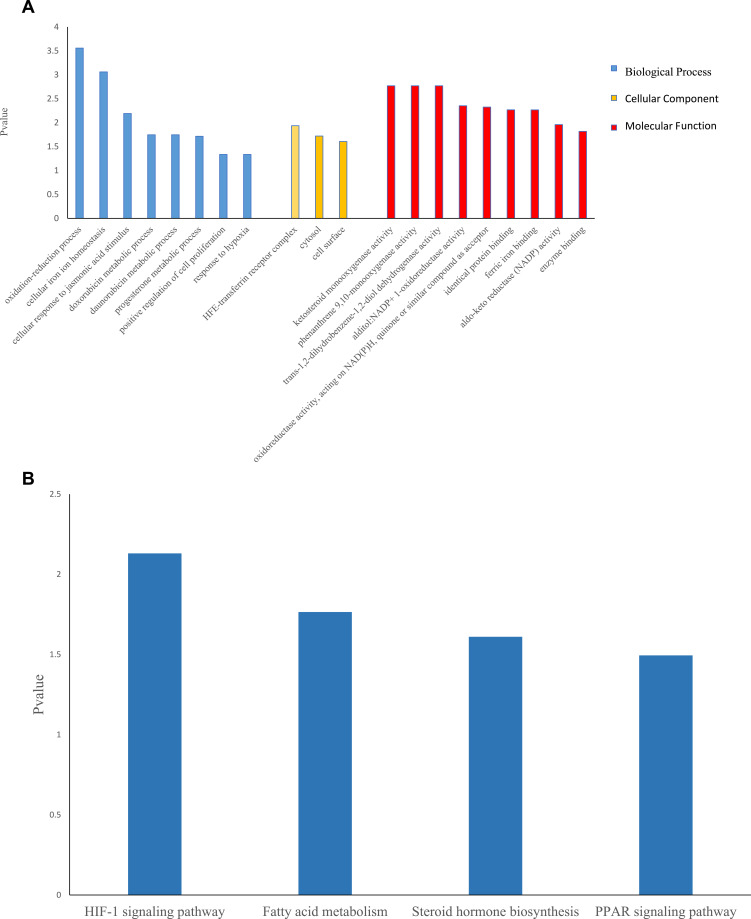
Figure 1.
GO and KEGG analyses for ferroptosis-related differentially expressed genes.
Notes: (A) Barplot graph for GO (the longer bar means the more genes enriched. Blue: biological process; yellow: cellular component; red: molecular function). (B) Barplot graph for KEGG (the longer bar means the more genes enriched).
Abbreviations: GO, Gene Ontology; KEGG, Kyoto Encyclopedia of Genes and Genomes pathway enrichment analysis.

