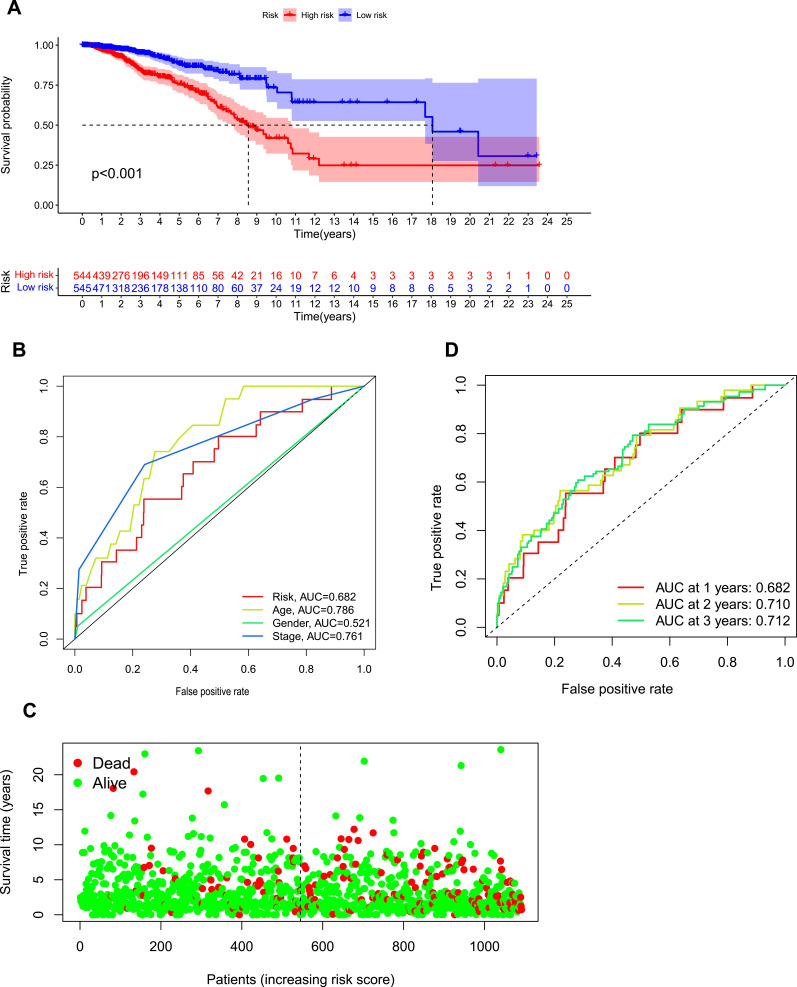
Figure 2.
Ferroptosis-related lncRNAs signature based on TCGA.
Notes: (A) Kaplan–Meier curves for BC patients in high- and low-risk group. (B) The AUC values showed the predictive efficiency of the risk factors (the AUC>0.6 means high accuracy of prediction). (C) The survival status for each patient (low-risk population: on the left side of the dotted line; high-risk population: on the right side of the dotted line). (D) ROC curve indicated the predictive efficiency of risk model for BC in 1, 2, 3-year.
Abbreviations: AUC, area under the curve; ROC, receiver operating characteristic; BC, breast cancer.

