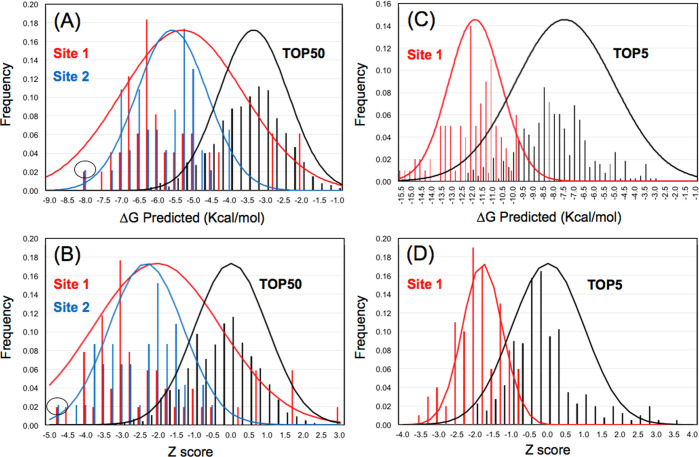
Figure 11.
Predicted ΔGbind energy distributions for OA saponin 12a binding to S2. (A) Predicted ΔGbind energy distributions for saponin 12a (without trisaccharide) docked to all of the TOP50 sites of the Spike S2 segment. (B) Statistical Zscore values of the energy distribution showing that the lowest energy cluster of both Site 1 and Site 2 is (Zscore = −4.8). (C) Predicted ΔGbind energy distributions for saponin 12a (with trisaccharide) docked to all of the TOP5 sites of the Spike S2 segment, comparing the distribution of Site 1 (red) to the rest of the distribution of the other TOP4 sites, which includes Site 2. (D) Statistical Zscore values of the energy distribution showing that the lowest energy cluster of Site 1 is (Zscore = −3.3) compared to the rest of the distribution which includes Site 2.

