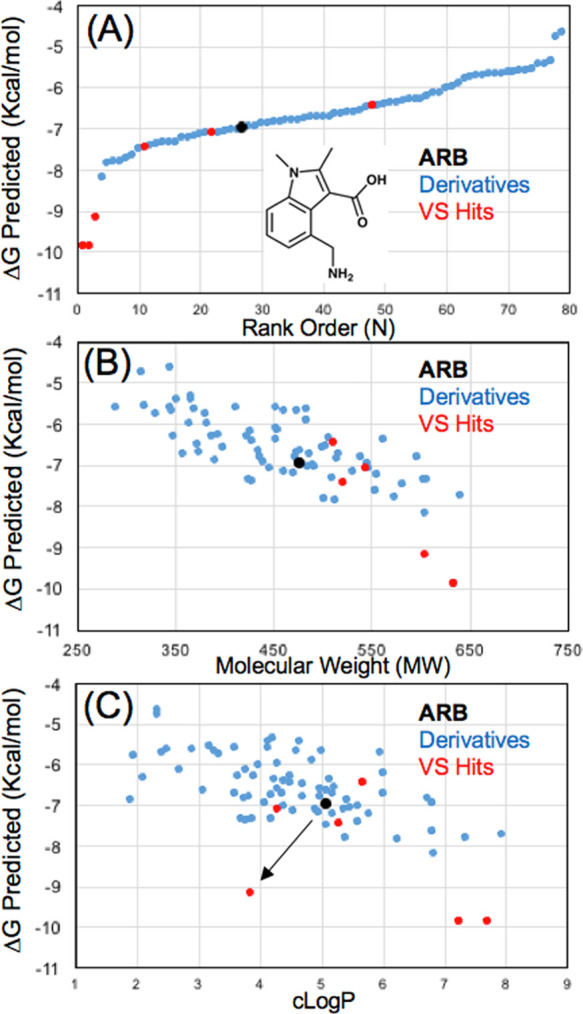
Figure 4.

Virtual screening data for Arbidol derivatives. (A) A ranked hit list of sorted predicted ΔGbind values where reference ARB is shown in black, VS hits are shown in red, and the rest of the derivatives are shown in blue. (B) Predicted ΔGbind values as a function of MW. (C) Predicted ΔGbind values as a function of cLogP. Derivative 4 is highlighted as a favorable VS hit with a lower cLogP value than the majority of the derivatives examined.
